
Figure 1.
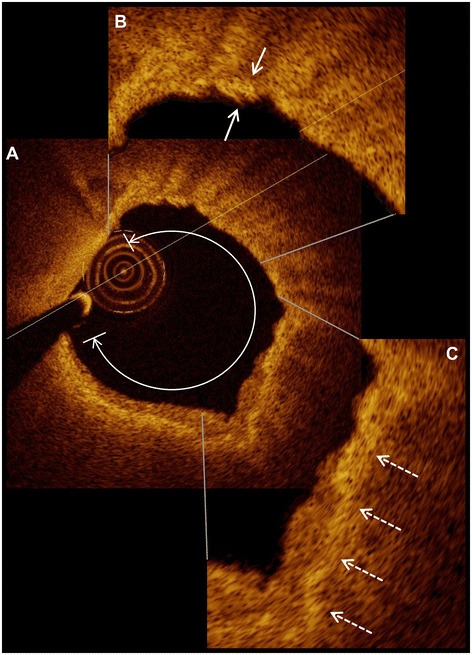
Representative optical coherence tomography images. A lipid-rich plaque (A) with a lipid arc of 282° is displayed. The right-upper high-power view (B) shows the fibrous cap measuring 52 μm (small arrows). Macrophages are visible in the right-lower high-power view (C) and are indicated with dashed arrows.