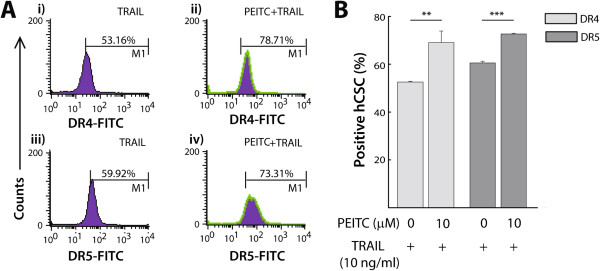
Figure 4.

PEITC up-regulated DR4 and DR5 receptors in TRAIL signaling. A) Representative FACS histograms of DR4 and DR5 expression in hCSCs treated with or without 10 μM PEITC in the presence of TRAIL. PEITC induced overexpression of DR4 (ii) and DR5 (iv) in comparison with DMSO controls (i) and (iii), respectively. The histograms do not show isotype controls. B) Quantitative bar diagrams presenting the groups from A (n = 3). All data represent means ± SEM, and significance was determined by comparing with naïve control as indicated: **p ≤ 0.01, ***p ≤ 0.001.
