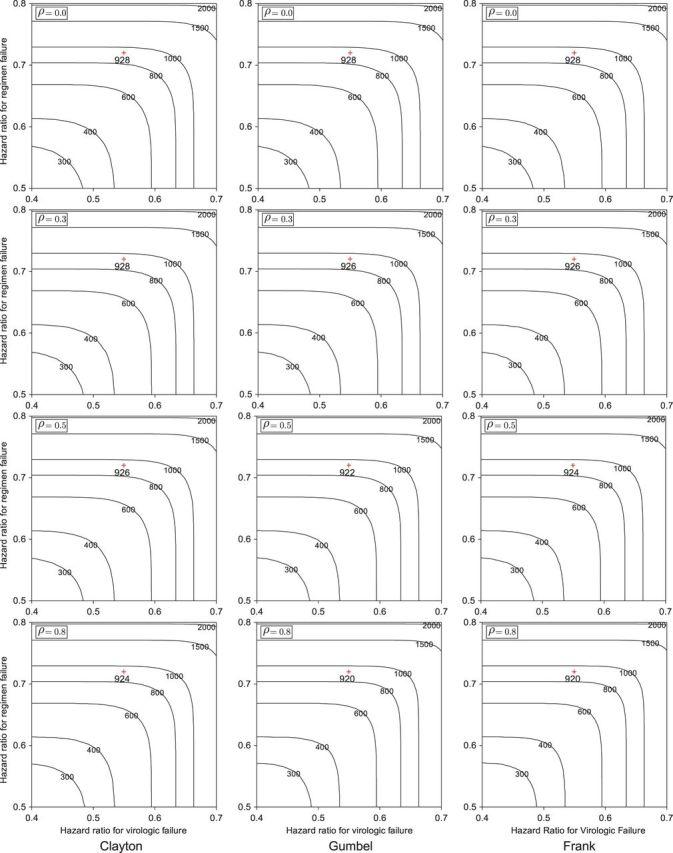
Fig. 1.

Contour plots of the required total sample size with the hazard ratios of time-to-events of virologic and regimen failures, and correlation for the three copulas. The sample size was calculated to detect the joint reduction for both time-to-event outcomes with the overall power of 0.90 at the one-sided significance level of 0.0125, where ρ=ρ(1)=ρ(2)=0.0, 0.3, 0.5, and 0.8;  , and
, and  ; τa=0, and τf=96; a(1)=0.5.
