
Figure 5.
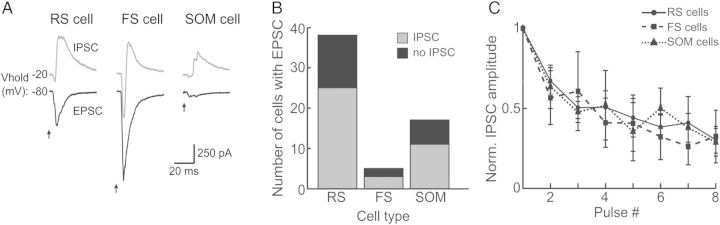
Optical stimulation of ChR2-M1 terminals evokes widespread disynaptic inhibition in RS cells, FS cells, and SOM cells within S1. (A) Examples of excitatory and inhibitory postsynaptic currents (EPSCs and IPSCs) in RS cells (left), FS cells (middle), and SOM cells (right) in response to ChR2-M1 stimulation. Cells were held at −80 mV for EPSC recordings and −20 mV for IPSC recordings. (B) Summary of number of neurons with both EPSC and IPSC responses by cell type. (C) Normalized IPSC amplitudes for RS cells (sold line; circles), FS cells (dashed line; squares), and SOM cells (dotted line; triangle) for a 10-Hz optical pulse train.