
Figure 6.
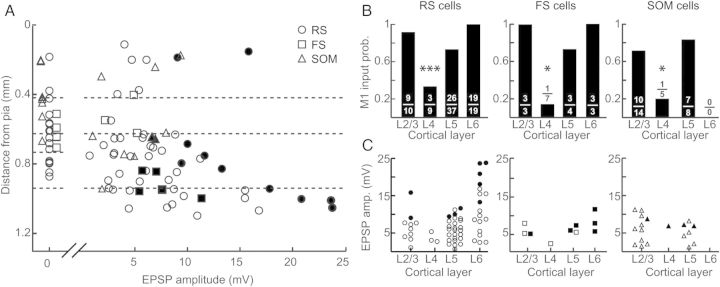
M1 inputs to excitatory and inhibitory neurons in S1 exhibit similar laminar distributions. (A) Amplitude of M1 input as a function of depth from pia. Each point represents EPSP amplitude in response to ChR2-M1 stimulation for individual cells (circles: RS cells; squares: FS cells; triangles: SOM cells). Dashed lines indicate laminar boundaries and were placed as follows (in μm from pia): L2/L3–L4: 419; L4–L5: 626; L5–L6: 940. Data plotted are a subset of data shown in (B) and (C). Filled circles represent cells that spiked in response to ChR2-M1 on at least 2 trials; open circles are cells that did not spike. (B) Probability of receiving an M1 input by layer for RS cells (left), FS cells (middle), and SOM cells (right). Numbers represent the number of cells that received input out of total number of cells recorded for that layer and cell type. (C) EPSP amplitude of evoked response to ChR2-M1 optical stimulation as a function of layer for RS cells (left; circles), FS cells (middle; squares), and SOM cells (right; triangles). Conventions as in (A).