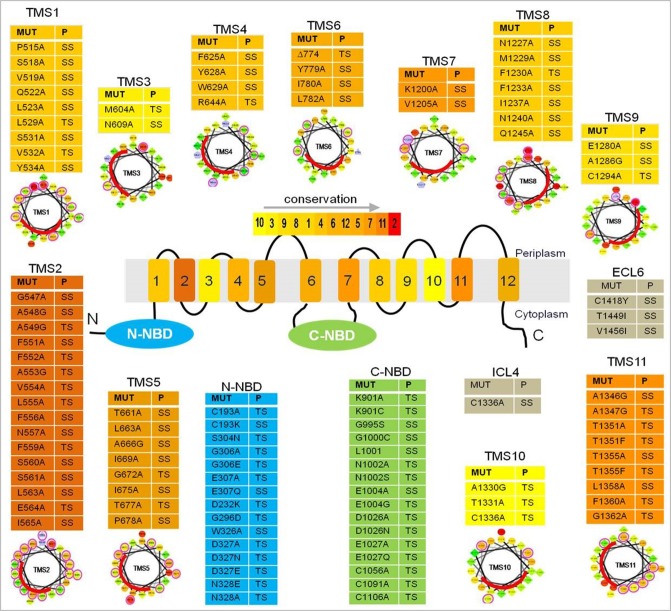
Figure 3.
A list of residues from Cdr1p that upon substitution gave a phenotype. The color gradient of individual TMS in the central Cdr1p cartoon shows the relative transmembrane conservation based on conservation scores obtained from JALVIEW2.4.0.b2 (Rawal et al., 2013). A red color indicates the highest conservation score while yellow indicates the lowest score. Abbreviations: MUT (mutants), P (phenotype), TS (susceptible to all drugs), SS (selectively susceptible), ECL (extracellular loop), NBD (nucleotide-binding domain), TMS (transmembrane segments). Below each table are the pepwheels showing LIPS (LIPid-facing Surface) residues. Helical wheel projections of each TMS sequence were constructed using http://rzlab.ucr.edu/scripts/wheel/wheel.cgi (Rawal et al., 2013). The sequences are displayed in a helical representation as if looking down the axis of the helix. The mutations that affected drug resistance are circled pink. The red curve on each wheel marks the location of the LIPS surface.

