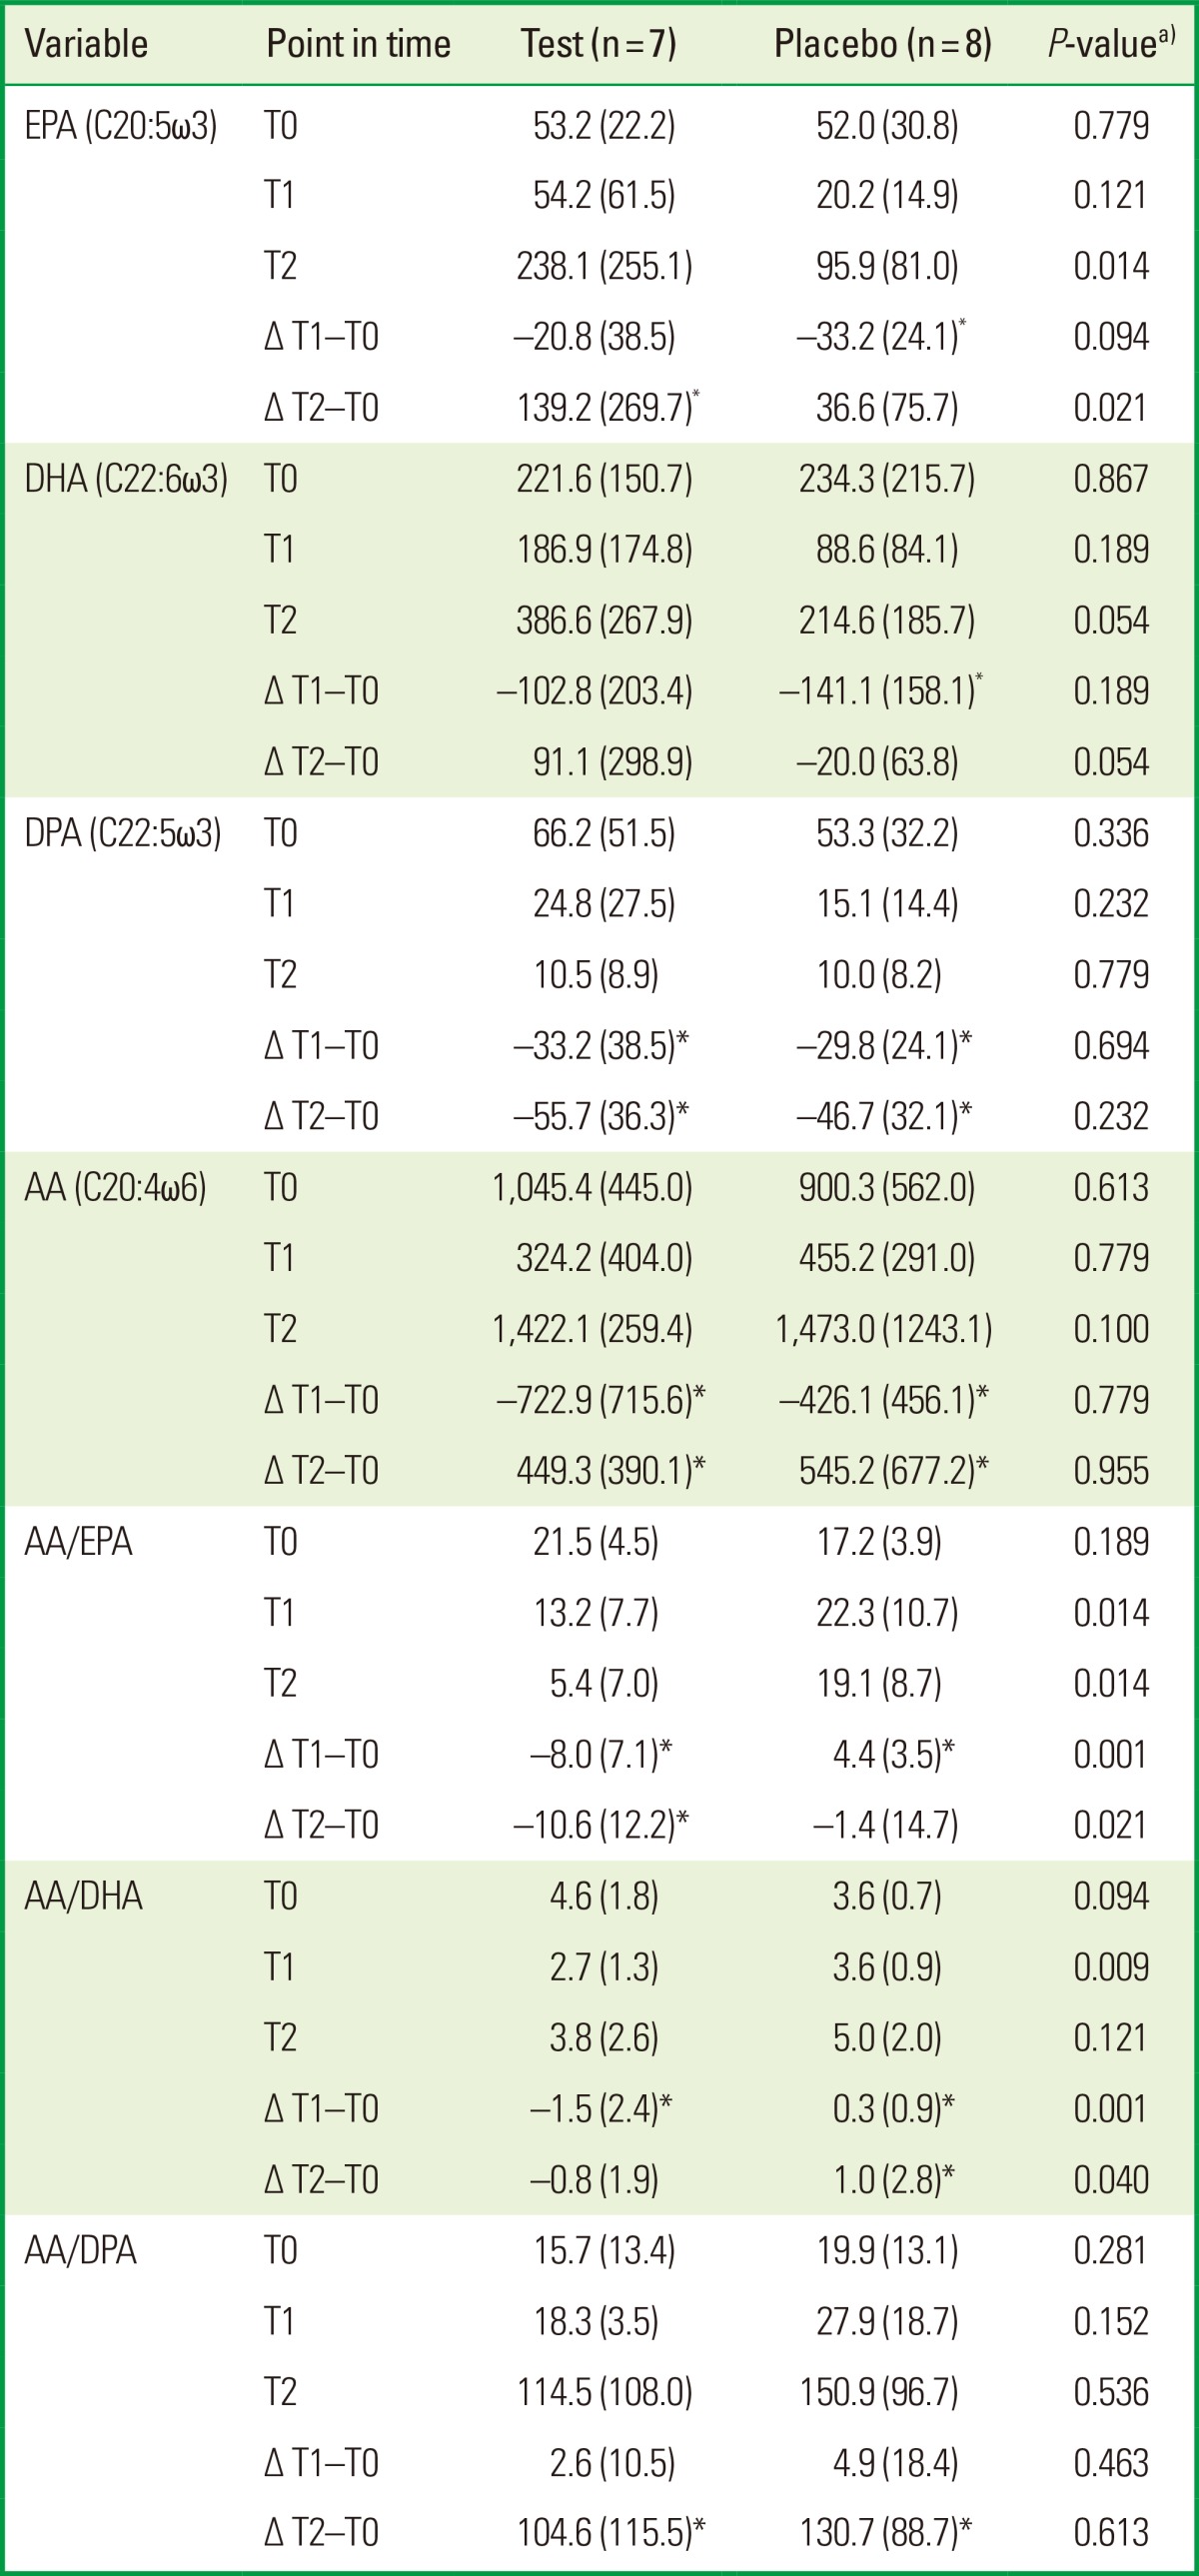
Table 3.
The median (IQR) serum level of LC-PUFA (µM/L) and the ω-6/ω-3 LC-PUFA ratios in the test and placebo groups at baseline (T0), 4 (T1), and 12 (T2) months.

Values are presented as median (IQR).
IQR: interquartile range, LC-PUFA: long chain-polyunsaturated fatty acids, EPA: eicosapentaenoic acid, DHA: docosahexaenoic acid, DPA: docosapentaenoic acid, AA: arachidonic acid.
a)Compared test and placebo groups (Mann-Whitney U-test). *P<0.05 compared the changes (Δ) at T0-T1 and T0-T2 in test and placebo groups (Wilcoxon rank sum test).
