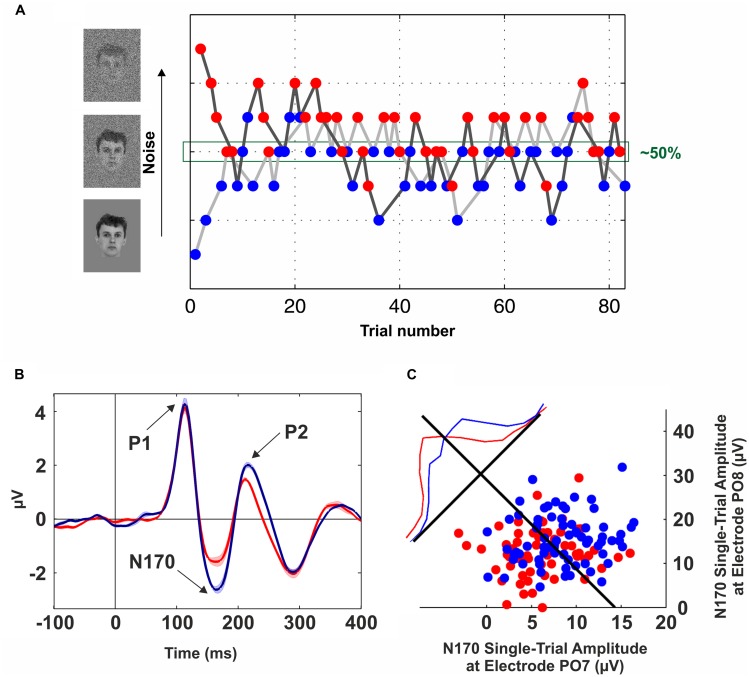
FIGURE 1.
Neural correlates of conscious face perception. (A) Brief flashes of faces with different levels of Gaussian noise were presented for 57 ms and combined with backward masking (mask duration: 443 ms). The noise level was tuned on a trial-by-trial basis following a double-staircase procedure, i.e., the noise was increased after a “seen” trial (blue dots) and decreased following an “unseen” trial (red dots). Trials from the upper staircase (dark gray line) and lower staircase (light gray line) were randomly interleaved. This method converges to a noise level of ~50%. Data from one participant of the experiment described in Navajas et al. (2013). (B) Grand-average of scalp event-related potentials (ERPs) elicited by “seen” (blue line) and “unseen” (red line) faces obtained with identical visual stimulation. The electrode site (PO8) was in the right occipito-temporal cortex. Three components are observed (P1, N170, and P2); however, the only one that was significantly modulated by conscious perception is the N170. The shaded area around the lines indicates SEM. (C) Decoding conscious reports with the single-trial N170 peak amplitude. Blue (Red) dots represent “seen” (“unseen”) trials in two occipito-temporal electrodes (PO7: left hemisphere, PO8: right hemisphere). The blue and red lines show the normalized distributions for “seen” and “unseen” trials projected along the axis perpendicular to the Fisher’s linear discriminant (black line). See Navajas et al. (2013) for further details.

