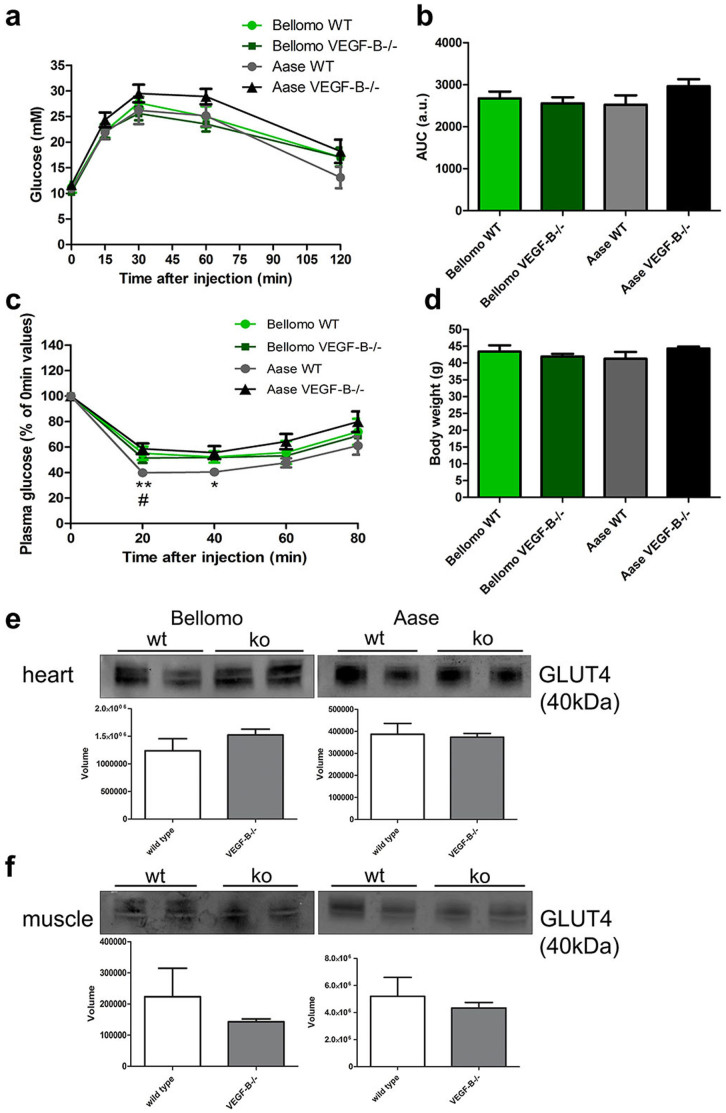
Figure 3. Body weight and glucose metabolism in both Vegf-b-/- strains.
(a). Response to intraperitoneal glucose tolerance test (IPGTT) after 15 weeks on 60% HFD. (b) Area under IPGTT curve. The glucose dose was 1 mg/g body weight. (c). Intraperitoneal insulin tolerance test (IPITT) after 17 weeks of 60% HFD. The insulin dose was 0.75 mU/g body weight. (d). Body weight on 60% HFD at the time of IPGTT. (e). Western blot analysis of GLUT4 protein in the plasma membrane fraction of the heart and (f) skeletal muscle (n = 2).Blot images were cropped for comparison. Densitometry analysis of GLUT4 expression in wild type (white bars) and Vegf-b-/- (grey bars) mouse heart (e) or skeletal muscle (f) was performed using ImageQuant software. The statistical analyses were performed with one-way ANOVA (a, b and d) or Student's t-test (e and f). In (c) Kruskal-Wallis with Dunn's post test with significant differences indicated by: # Aase WT versus Bellomo WT p<0.05, ** Aase WT versus Aase Vegf-b-/- p<0.01 and * Aase WTversus Aase Vegf-b-/- p<0.05 in (c). Results are expressed as mean ± S.E.M. n = 6–13.

