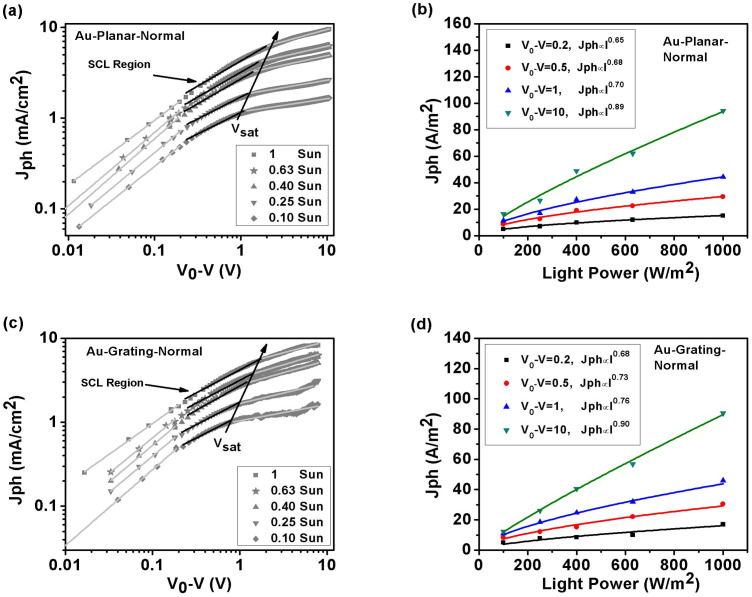
Figure 9. SCL characteristics for Au-normal OSCs measured at room temperature (T = 300 K).
Left graphs are photocurrents versus effective applied voltage (V0-V) at different incident light intensities. (a) Au-planar-normal device, and (c) Au-grating-normal device. The black solid lines in (a) and (c) represent the square-root dependence of photocurrent on effective applied voltage (SCL region). Right graphs are photocurrents versus incident light intensity at different effective applied voltages. (b) Au-planar-normal device, and (d) Au-grating-normal device.

