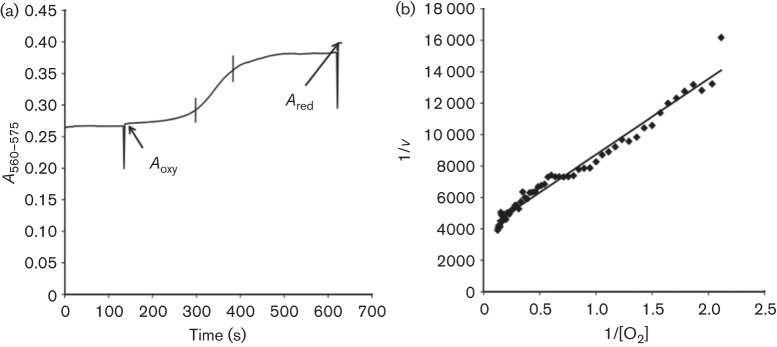
Fig. 1.

Kinetics of myoglobin deoxygenation resulting from oxygen consumption by cytoplasmic membrane preparation. (a) A typical time course of the absorbance difference at 575/560 nm with Zm6 membranes; Aoxy is the absorbance difference recorded immediately after addition of membranes into the assay with oxygenated myoglobin; Ared is the absorbance difference reached after deoxygenation of myoglobin and addition of a small amount of reductant (dithionite). (b) The absorbance differences [between the two vertical bars in (a)] were taken for calculations and for building of Lineweaver–Burk plots of oxygen consumption rate versus the free oxygen concentration, used to find the Km values (here the calculated Km value is 1.24 µM).
