Fig. 3.

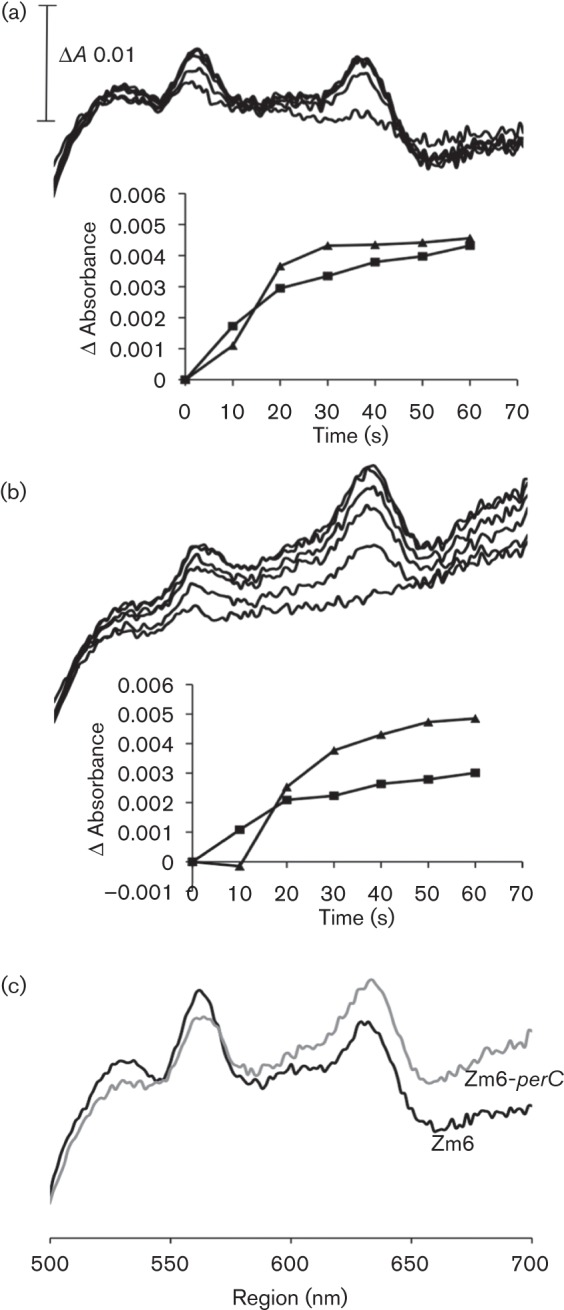
Cytochrome reduction with NADH in membrane preparations. (a) Time course of cytochrome reduction in membranes of Zm6, and (b) the same in membranes of Zm6-perC; spectra were recorded at 10 s intervals during the first minute after NADH addition. Insets: the time course of absorbance of cytochrome d (mean absorbance differences at wavelength pairs 630/614 and 630/646 nm) (▴), and of c- and b-type cytochromes (the wavelength pairs 560/545 and 560/575 nm) (□). (c) The cytochrome spectra 3 min after NADH addition.
