
Figure 3.
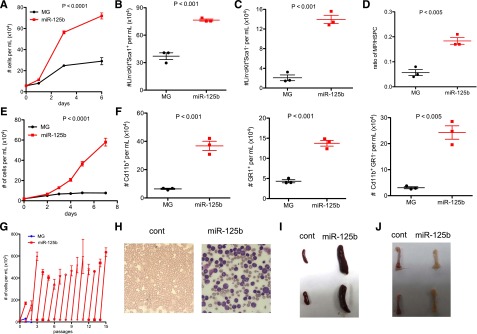
Effect of overexpressing miR-125b in HSPCs and MPs. (A) Equal numbers of MG or MG-125b–transduced Lin−cKit+Sca1+ HSPCs were cultured, and the cell density was determined using flow cytometry. Two-way analysis of variance was used to obtain P values. The number of (B) Lin−cKit+Sca1+ HSPCs and (C) Lin−cKit+Sca1− MPs was determined by flow cytometry 6 days after culture. (D) The ratio of MPs to HSPCs was calculated and plotted. Two independent experiments were performed. (E) Equal number of MG or MG-125b–transduced Lin−cKit+Sca1− MPs were cultured. The cell density was determined according to the indicated time. Representative of two independent experiments. (F) The density of myeloids (Cd11b+), granulocytes (GR1+), or nongranulocytic myeloids (CD11b+GR1−) cells after growing miR-125b–overexpressing MPs was determined by flow cytometry 10 days later. Two independent experiments performed. (G) Sorted MG or miR-125b–transduced Lin−cKit+ Sca1− MPs were cultured and passaged similarly as described in the Figure 2E legend. (H) Sublethally irradiated C57bl/6 recipients were injected with common myeloid progenitors sorted from MG-125b mice. Wright stain of the blood was performed when the recipients were moribund. (I) The spleen and (J) femur were harvested and imaged when the mice were moribund and sacrificed. Representative of 4 mice. Control mice represent recipient mice injected with BMCs from MG mice.