
Figure 4.
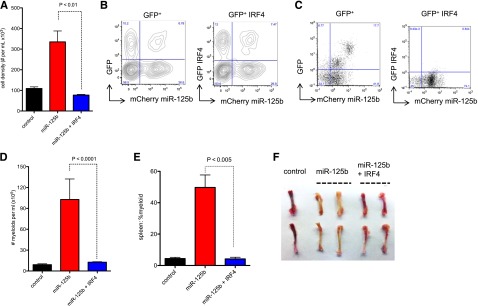
Rescued expression of IRF4 inhibits miR-125b–induced myeloid leukemia. (A) IRF4 inhibits miR-125b–induced hyperproliferation in vitro. Control cells correspond to MG-infected BMCs. BMCs were transduced with retroviruses that encode miR-125b and HcRed. These cells were then transduced with MG or MIG-IRF4 retroviruses, which coexpresses GFP and IRF4. HcRed+GFP+ cells were sorted, and 20K cells per mL of cells were plated. The cell number was determined 3 days later. Representative of 3 experiments. (B) BMCs were transduced with retroviruses that encode miR-125b and mCherry. These cells were then infected with MG or MIG-IRF4 viruses. Shown are flow cytometric plots of these cells and infection efficiency before transplantation into mice. Plots show cells overexpressing miR-125b in the x-axis (mCherry+) and either GFP+ or GFP+ IRF4-overexpressing cells in the y-axis. (C) BMCs described in panel B were transplanted into recipient C57bl/6 mice. One month after transplantation, the peripheral blood of the recipient mice was analyzed by flow cytometry. The left and right panels represent the blood of recipient mice transplanted with BMCs coinfected with miR125b-mCherry with GFP vector and miR125b-mCherry with IRF4-GFP vector, respectively. Representative of 4 mice. (D) Recipient mice were transplanted with donor BMCs that overexpress miR-125b alone or along with restored IRF4 expression mice. The peripheral blood of the recipient mice (>6 mice per group) was analyzed by flow cytometry. Plot displays the Cd11b+ myeloid cell count 3 months after transplantation of donor cells. Control mice represent normal healthy C57bl/6 mice. P value obtained through Mann-Whitney t test. (E) The percent splenic Cd11b+ myeloid was determined using flow cytometry ∼3 months after cell transplantation. (F) Representative images of the femur and tibia of the corresponding recipient mice are shown.