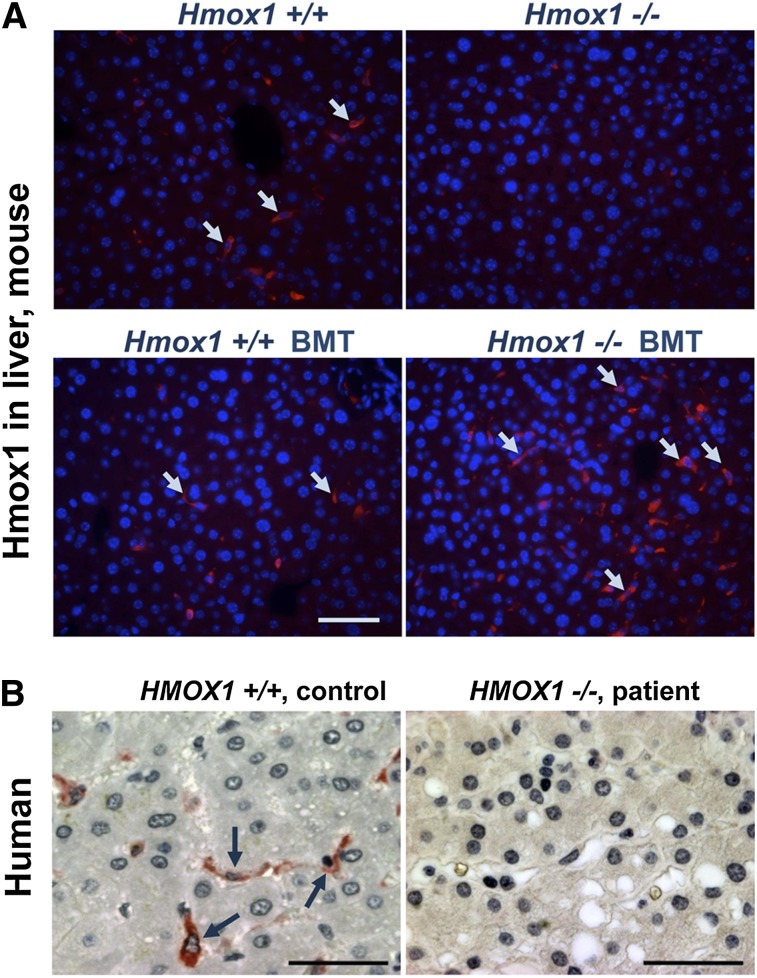
Figure 5.
Comparison of Hmox1 protein expression in mouse and human liver tissue of controls with Hmox1-deficient animals and patient samples. (A) Cross-sections of paraffin-embedded liver tissue immunofluorescence showed that Kupffer cells were a major site of Hmox1 expression in both WT Ctr and WT BMT mice (left); no specific Hmox1 signal was detectable in the liver KO Ctr animals (upper right); an Hmox1-expressing Kupffer cell population was restored in the liver of transplant recipients (bottom right). Arrows point to Hmox1-positive cells. (B) A human liver biopsy specimen obtained from human with intact HMOX1 gene showed high HMOX1 signal present in Kupffer-like cells (left), whereas there was no HMOX1 expression in the liver sample of an HMOX1-deficient patient specimen (right). Scale bars represent 50 μm (A) and 25 μm (B).

