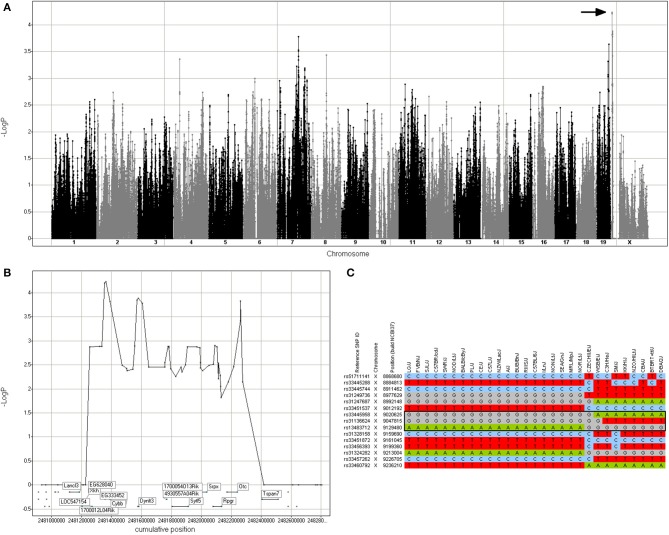
Figure 3.
Genomic region associated with rotenone cytotoxicity. (A) GWA Manhattan plot for cell loss after 72 h of rotenone treatment. The region with the highest -log p-value that was selected for further analysis is indicated by the arrow. (B) Detail of the region in chromosome X annotated with the candidate genes. (C) Haplotype structure of the inbred mouse strains in the region. The black box indicates the 3-SNP haplotype with the best SNPster association score, which includes the Cybb gene (chromosome X 9,012,380–9,046,450).

