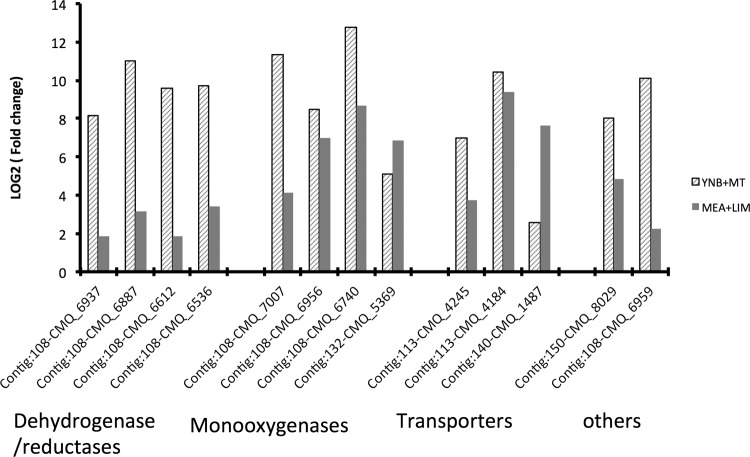
FIG 2.
Upregulated genes with mRNA abundance fold changes greater than 100 under at least one growth condition. Gray bars indicate growth in MEA with limonene (MEA plus LIM) versus MEA, while diagonal bars indicate growth in YNB with a monoterpene mixture (YNB plus MT) versus YNB with mannose as a carbon source.

