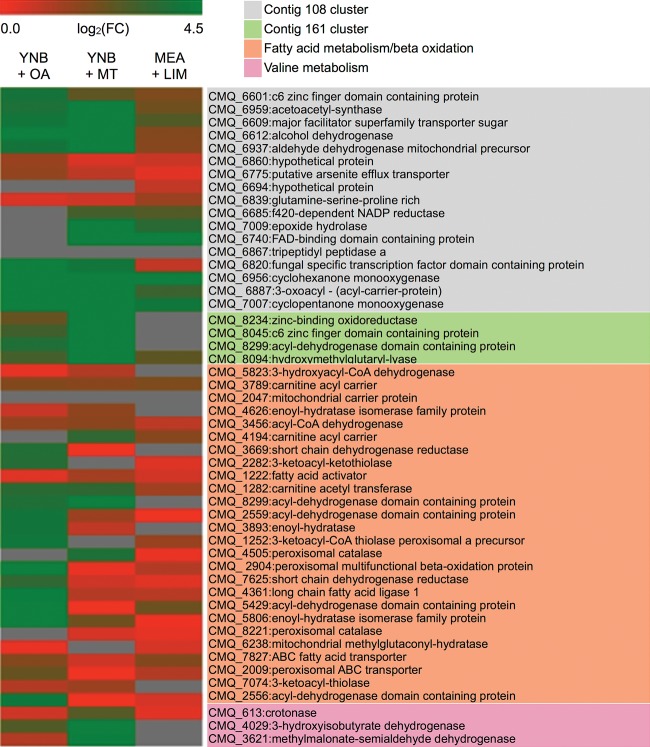
FIG 3.
Expressed clusters and genes potentially involved in monoterpene degradation. The heatmap was generated by the MultiExperimental Viewer (MeV). Relative abundances of each gene (rows) in each growth condition (columns) are shown as log-transformed fold change (FC) relative to the condition's control. Red versus green shows low versus high FC.

