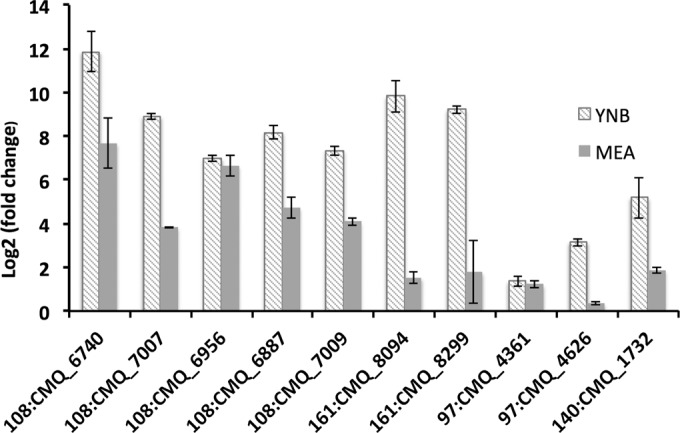
FIG 4.

qRT-PCR validates the mRNA abundance of selected genes on YNB plus MT (diagonal bars) and MEA plus LIM (gray bars). Growth and treatment conditions were the same as for transcriptome analyses. mRNA abundance was normalized using the β-tubulin gene, a housekeeping gene; error bars show standard deviations based on three technical replicates.
