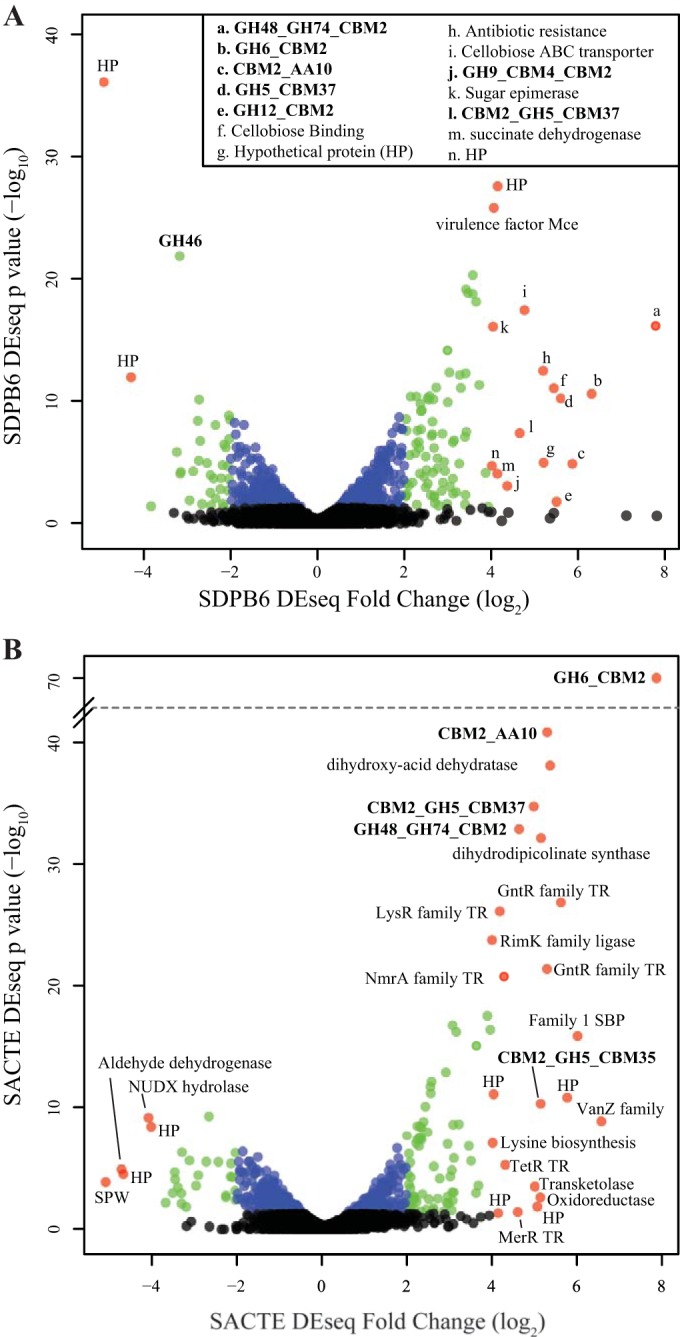
FIG 5.

Differential expression of genes from SDPB6 (A) and SACTE (B) grown on glucose versus AFEX-pretreated corn stover. Each point represents a gene; the x axis shows the log2 fold change between carbon sources, and the y axis shows the −log10 of the P value for the measured fold change. Red points represent genes with more than a 4-fold change, green points represent genes with a 2- to 4-fold change, blue points represent genes with statistically significant changes less than 2-fold, and black points represent non-statistically significantly induced genes (P > 0.05). Annotations are shown for genes with more than a 4-fold change; bold indicates a CAZy gene family (HP, hypothetical protein).
