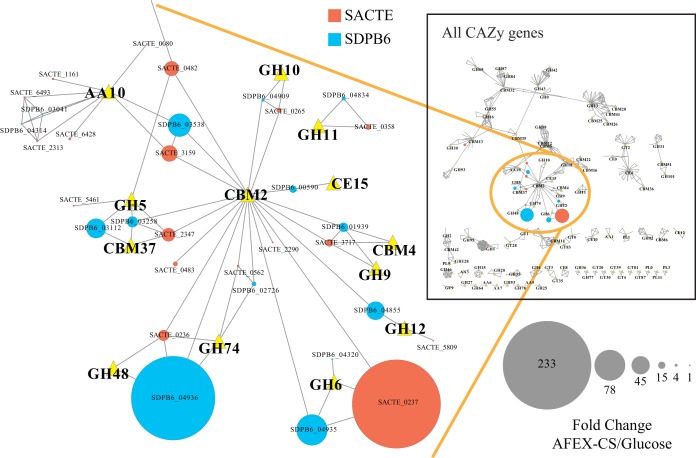
FIG 6.
Protein similarity network of CAZymes present in SDPB6 and SACTE. Nodes are proteins (circles) or CAZy functional categories (yellow triangles); edges indicate that the gene belongs to the respective CAZy family or a BLAST similarity with an E value less than 1e−50. Node size represents the fold change in RNA abundance between AFEX-CS and glucose. The inset shows all CAZy proteins; the expanded region shows highly induced genes.

