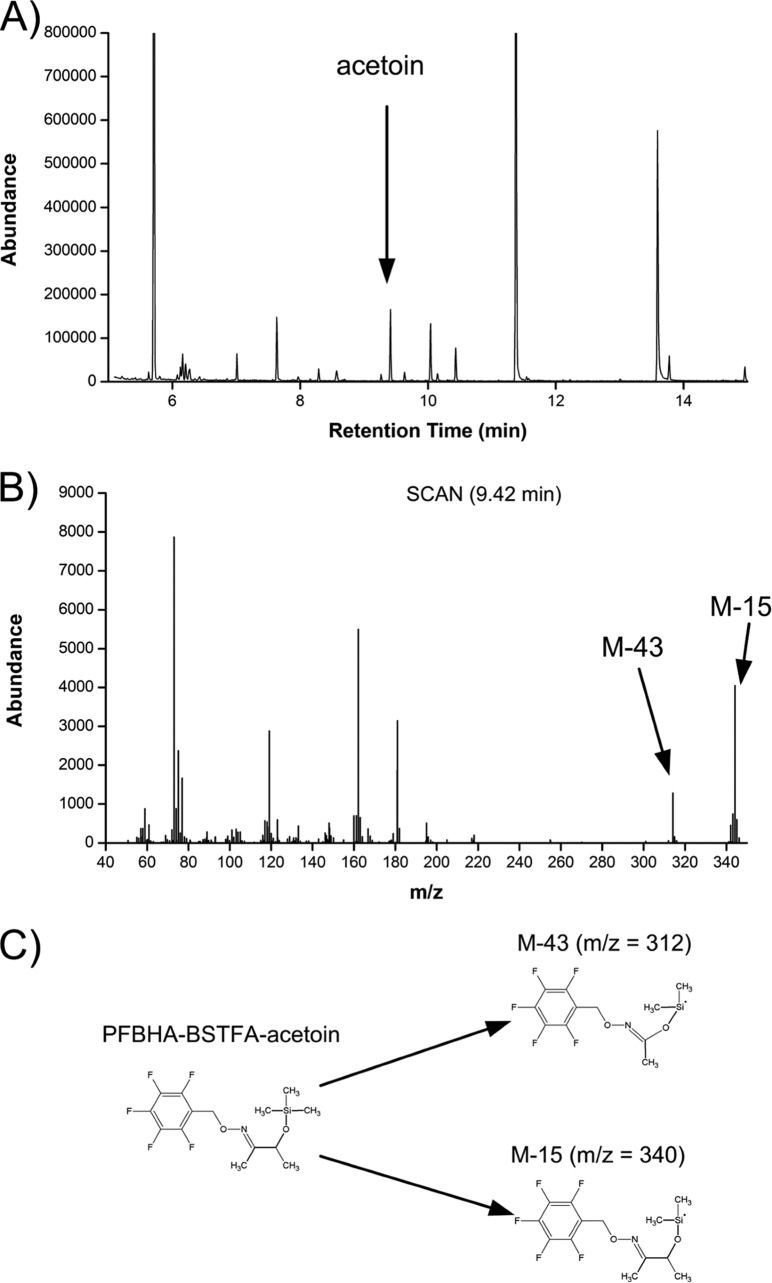
FIG 3.
GC/MS analysis of the 13C labeling pattern of acetoin in culture supernatant. (A) Total ion current of the sample after derivatization with PFBHA and BSTFA, with acetoin eluting after 9.42 min; (B) the corresponding mass spectrum of PFBHA-BSTFA-acetoin; (C) chemical structure of PFBHA-BSTFA-acetoin and the corresponding fragments M-15 and M-43.

