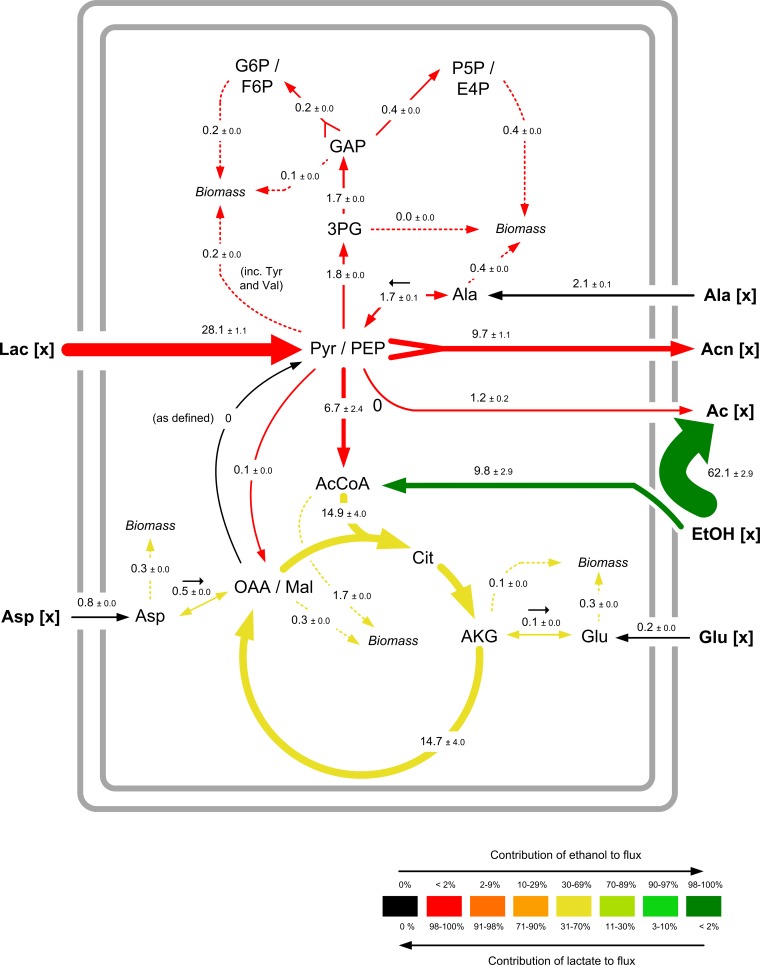
FIG 8.
Metabolic fluxes of A. pasteurianus NCC 316 during the first growth phase in cocoa pulp simulation medium. The data are given as relative fluxes, normalized to the cumulative uptake flux of lactate and ethanol (see Tables S10 and S11 in the supplemental material). The relative flux intensity is illustrated by the arrow thickness, and the individual contribution of lactate and ethanol to the fluxes is indicated by the arrow color. Solid arrows correspond to central metabolic fluxes, and dashed arrows correspond to the drain of precursors into biomass. The net direction of a reversible reaction is indicated by a small black arrow. The fluxes were derived via metabolite and isotopomer balancing recruiting extracellular fluxes (see Table S11 in the supplemental material) and the 13C labeling pattern of proteinogenic amino acids and acetate. Simulated and experimental mass isotopomer distributions are presented in Fig. S3 in the supplemental material. In addition to the net fluxes (in large type), 90% confidence intervals from Monte Carlo analysis are shown (in smaller type). [x], extracellular substrates and products.

