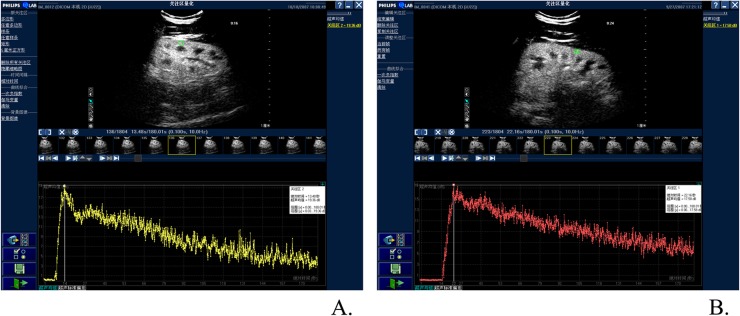
Figure 2.
Comparison of time–intensity curves (TICs) between patients with early chronic kidney dysfunction (CKD) and the control group; compared with the normal groups, the curves of patients with early CKD had no obvious change in the shape of TICs. In both the groups, TICs of renal cortex perfusion were asymmetrical curves with obvious steep ascending slope, peak and flat descending slope. (a) TIC of patients with CKD (Stages I–II); (b) TIC of the control group.

