Figure 3.
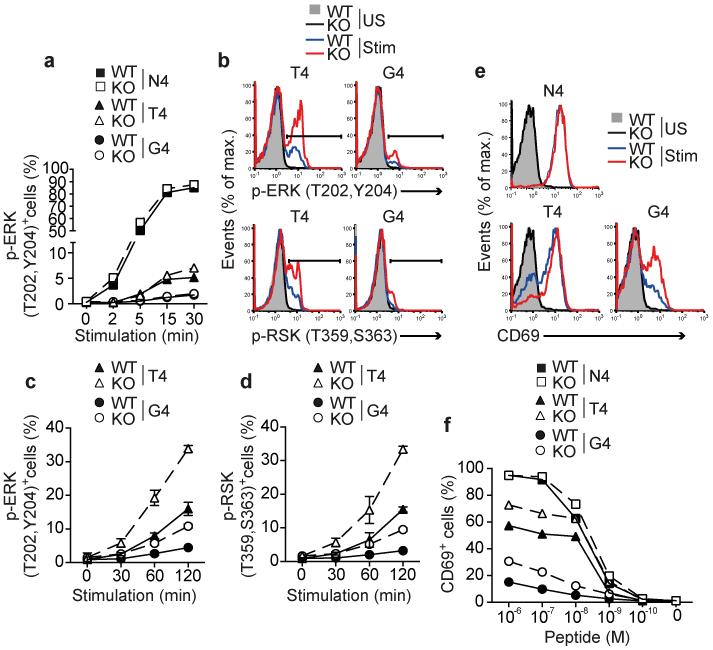
Ptpn22 limits weak agonist induced TCR triggering in naive T cells. Responses of WT and Ptpn22−/− (KO) OT-1 cells are indicated throughout. (a) Proportions of phospho-ERK+ CD8 T cells following stimulation with 10−6 M peptide for the time periods indicated. (b) Representative histograms showing intracellular staining for p-ERK and p-RSK following 2h stimulation with 10−6 M T4 or G4 peptide. Time courses of ERK (c) and RSK (d) activation following T4 and G4 stimulation; symbols represent mean values and error bars SD (n=3 replicate samples). (e) Histograms showing surface CD69 expression under basal conditions (unstimulated – US) or following 4h stimulation (Stim) with 10−6 M variant peptides. (f) Dose response curves of CD69 upregulation. For all graphs, data are representative of 1 of at least 3 repeated experiments.

