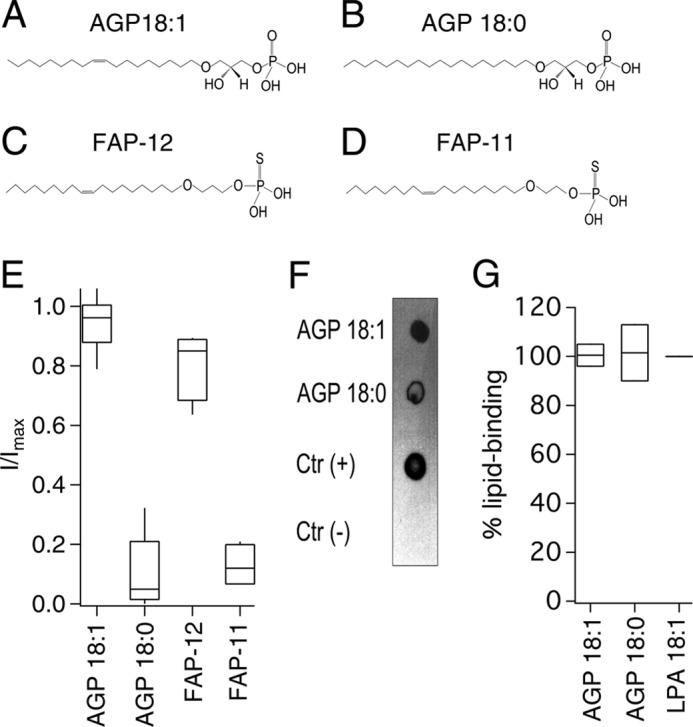
FIGURE 5.

Specificity of activation of TRPV1 by alkyl lipids. A–D, chemical structures of AGP18:1 (A) and AGP18:0 (B) of FAP-12 (C) and FAP-11 (D). E, horizontal line within each box indicates the median; boxes show the 25th and 75th percentiles, and whiskers show the 5th and 95th percentiles of the data percentiles of the data obtained at +120 mV and normalized to activation by 4 μm capsaicin (n = 6 for AGP 18:1; 5 for AGP 18:0; and 4 for FAP-12 and FAP-11). F, overlay assay shows that AGP 18:1 and AGP 18:0 bind to TRPV1. LPA 18:1 was the positive control indicated as Ctr (+) and DMEM with 1% fatty acid-free BSA was used as a negative control indicated as Ctr (−). G, densitometry was performed for the different lipid spots and normalized with respect to the positive control (LPA 18:1). Data are shown as in E (n = 2).
