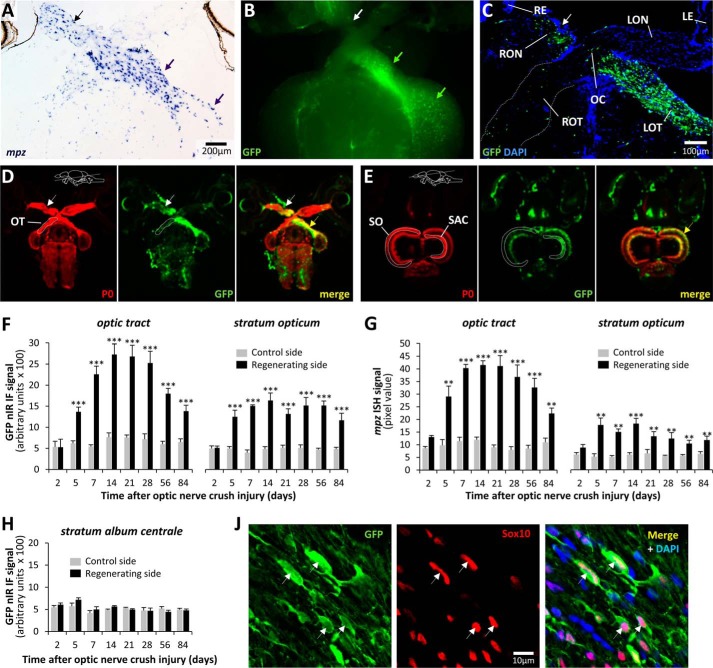
FIGURE 4.
The 10-kb mpz:egfp construct contains an oligodendroglial axonal injury response element. A, a section through the optic chiasm of a WT zebrafish is shown, 2 weeks after crush injury to the right optic nerve (black arrow; the convention followed throughout is that brain sections are shown as viewed from the ventral surface for consistency). The section was labeled by RNA in situ hybridization for endogenous mpz mRNA (blue/purple chromogenic product). Robust up-regulation of mpz is clearly seen in the right optic nerve, left optic tract, and left optic tectum (purple arrows). B, GFP epifluorescence (green) micrograph of the ventral surface of a freshly dissected Tg(mpz:egfp) brain, 2 weeks after right optic nerve crush injury (white arrow), showing robust GFP up-regulation in the right optic nerve, left optic tract, and left optic tectum (green arrows). C, confocal z-plane projection of a horizontal section through the optic chiasm of a Tg(mpz:egfp) brain, 2 weeks after right optic nerve crush injury (arrow), labeled for GFP (green) and DAPI (blue). RE, right eye; LE, left eye; RON, right optic nerve; LON, left optic nerve; OC, optic chiasm; ROT, right optic tract; LOT, left optic tract. D and E, high-resolution nIR-qIF scans of optic tracts (D) and optic tectum (E) from Tg(mpz:egfp) brain, 2 weeks after right optic nerve crush injury (arrow), labeled with antibodies to GFP (680-nm channel; pseudocolored green) and myelin P0 (800-nm channel; pseudocolored red). The planes of the sections and anatomical landmarks defining regions of interest are annotated in the P0 image for each set. The site of the optic nerve lesion is indicated with a white arrow, and up-regulation of the GFP transgene is shown with a yellow arrow. F, the nIRqIF GFP-immunoreactive signal from the optic tract and stratum opticum was quantified in Tg(mpz:egfp) brains, as shown in D and E, at time points between 2 and 84 days after optic nerve crush injury. For each time point, the regenerating and control sides of the same sections were analyzed in four animals. Graphs show mean and S.E. (error bars); ***, p < 0.0001, control versus regenerating side; paired t test with Bonferroni correction for multiple comparisons. G, the RNA in situ hybridization signal for mpz was quantified in the optic tract and stratum opticum of the same animals shown in F. For each time point, the regenerating and control sides of the same sections were analyzed. Graphs show mean and S.E. (error bars); ***, p < 0.0001; **, p < 0.001, control versus regenerating side; paired Student's t test with Bonferroni correction for multiple comparisons. H, the nIR-qIF GFP-immunoreactive signal from the stratum album centrale (see E) was quantified in the same sections from which data were acquired for F. Graphs show mean and S.E. J, a single confocal plane of the regenerating left optic tract, 2 weeks after optic nerve crush injury, is shown, labeled for indirect immunofluorescence with antibodies to GFP (green; left) and Sox10 (red; center), with a nuclear counterstain (DAPI; blue channel in merged image). Examples of cells showing co-localization of GFP and Sox10 are shown (arrows).

