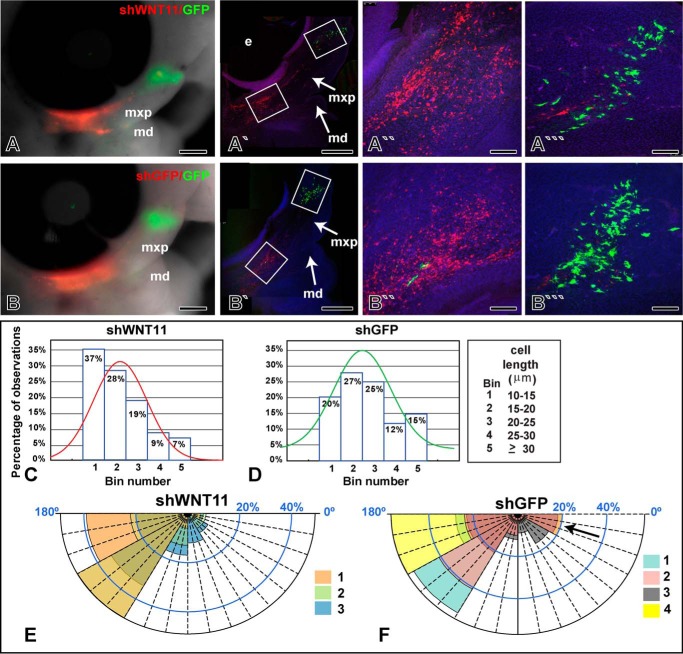
FIGURE 7.
Knockdown with shWNT11 plasmid shortens and orients cells. A and B, macroscopic views of embryos transfected with RFP-shWNT11 or the control, RFP-shGFP plasmids posteriorly and GFP plasmid anteriorly. Transfections were carried out at stage 18, and embryos were grown for 24 h until they reached stage 24. A′–B‴, confocal images of sagittal slices through the face. The transfection of the RFP plasmid was increased relative to Fig. 6 to more effectively knock down WNT11 expression. Red cells reflect native RFP signal, and green cells were stained with an anti-GFP antibody. More of the cell processes are visible in the antibody-stained cells giving the impression they are larger than the RFP cells. C and D, histograms showing distribution of cells according to length measurements taken in Image J, across the stack. Only RFP-positive cells are shown. The curves show the general distribution of observations about the median. The shGFP cell curve is shifted toward higher bin numbers than the shWNT11 curve. E, close clustering of cell orientation wedges in shWNT11-transfected cells. F, more randomized orientation of shGFP cells (arrow) in an equivalent region of the maxillary prominence. Each color represents data from a different embryo. The abbreviations used are as follows: md, mandibular prominence; mxp, maxillary prominence. Scale bar, 500 μm for A, A′, B, and B′, 100 μm for A″, A‴, B″, and B‴.

