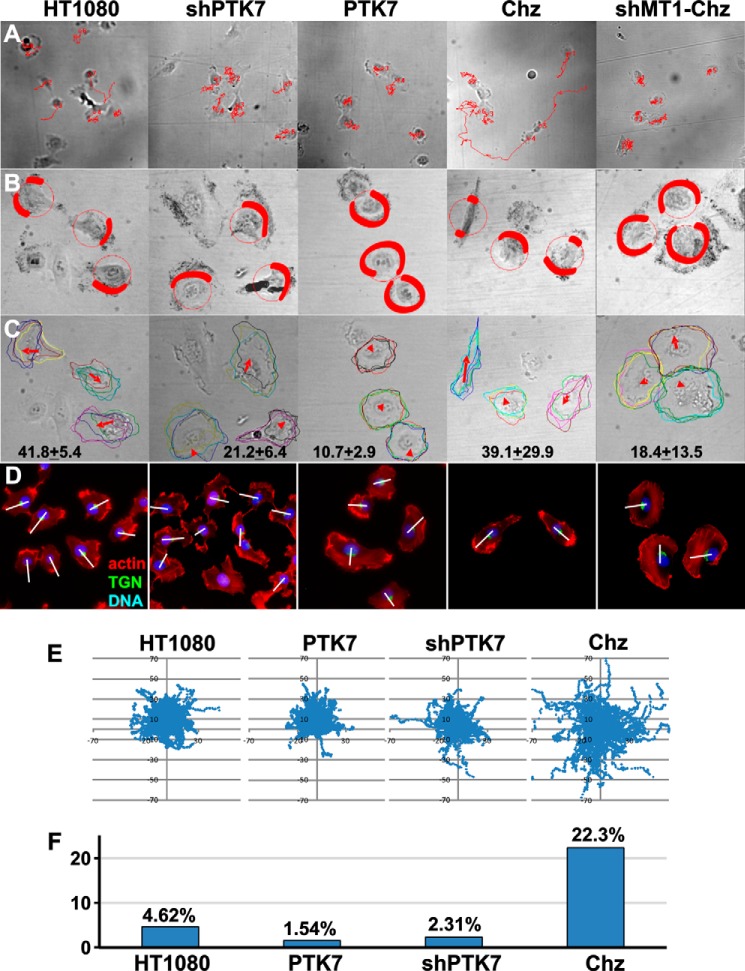
FIGURE 3.
Tracking and morphometric analysis of the cells. A, images were taken every 5 min for 8 h (10 × 0.3 numerical aperture objective) and analyzed with Metamorph software to reconstruct the tracks of the individual migrating cells (red lines). Cell positions at time = 0 and the reconstructed tracks are shown. B, lamellipodial dynamics in the cells. Images were acquired every 1 min for 1 h (20 × 0.75 numerical aperture objective), and the whole time lapse was then projected onto a single plane. Membrane areas with high lamellipodial activity appear dark in the merged images. Red shading outlines the areas with high lamellipodial activity. Note that in the polarized HT1080 and Chz cells lamellipodia represent a limited fraction of the cell perimeter, whereas in the non-polarized PTK7 and shMT1-Chz cells, lamellipodia occupy a significant portion of the cell perimeter. C, directionality of lamellipodial protrusion. Images were acquired as described in B and processed to show the outlines of the cells at time = 0 and at times = 20, 40, and 60 min. Red arrows point to the direction of migration. The arrow length and the numbers at the bottom panel indicate the migrated distance (based on nuclear position). D, labeling of HT1080, shPTK7, PTK7, Chz, and MT1-Chz cells using phalloidin (red, actin), DAPI (blue, nuclei), and the trans-Golgi network (green, TGN46 (TGN)). The nucleus-TGN46 axis is shown by the white lines drawn through the cell body. E, overlaid migration track coordinates (in microns) of HT1080, PTK7, shPTK7, and Chz cells. Images described in A were imported from Metamorph (100 cell tracks each). F, relative motility of HT1080, PTK7, shPTK7, and Chz cells. Migration tracks of individual HT1080, PTK7, shPTK7, and Chz cells were digitized and analyzed to calculate the percentage of cells with a migration distance >40 microns (measured from the cell origin; time = 0) relative to the total number of cells.

