
FIGURE 4.
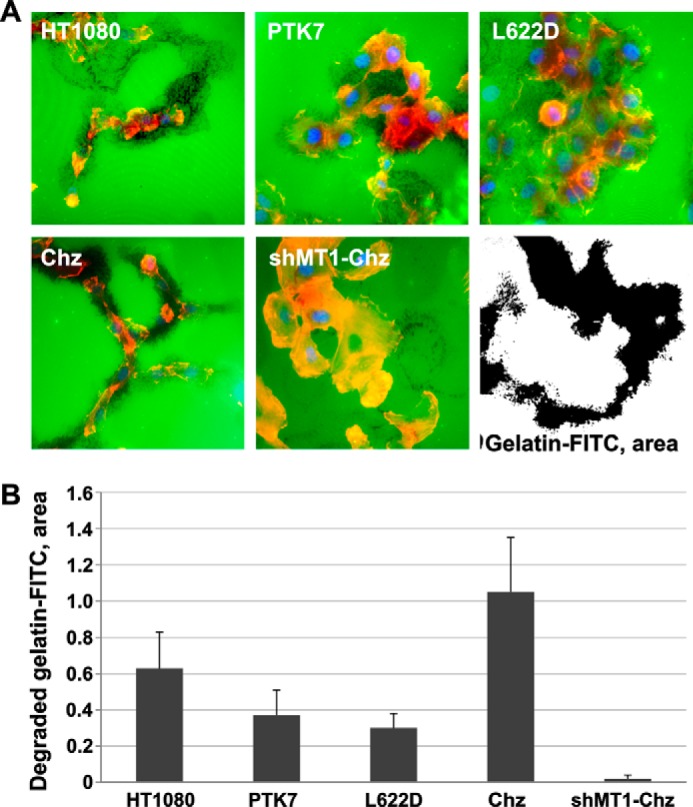
FITC-gelatin degradation assay. A, representative fluorescence images of cells grown on FITC-gelatin (green). Cells were plated on FITC-gelatin. At 72 h, cells were fixed and stained using phalloidin (red, actin) and DAPI (blue, nuclei). Black dots show the areas of the degraded gelatin. A representative black and white image shows the approach we used to highlight the degraded (black) FITC-gelatin area and quantify our data, which are presented in B. B, the degraded FITC-gelatin area was quantified with ImageJ (39).