FIGURE 6.
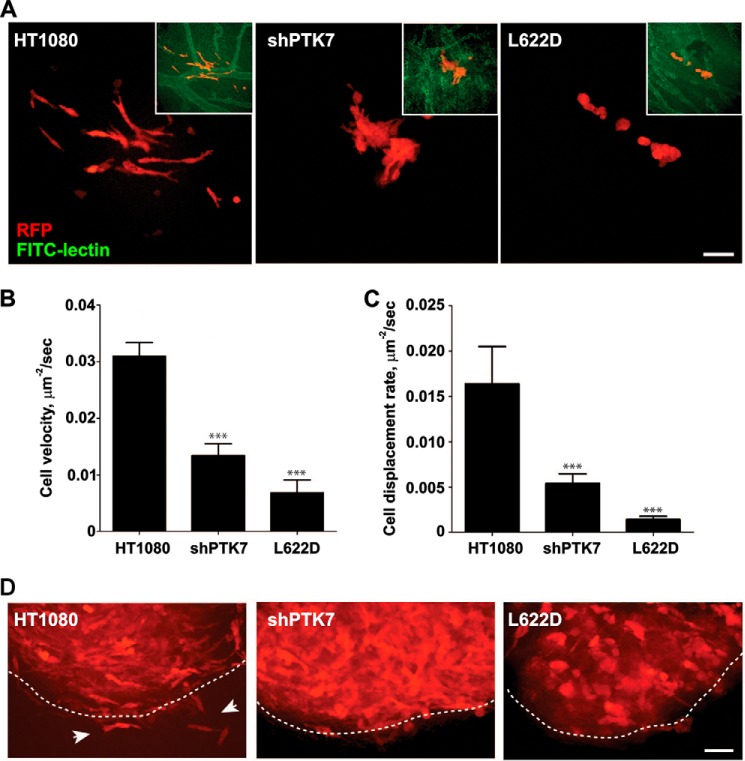
PTK7 regulates HT1080 cell invasion in the chick embryo model in vivo. A, representative images of the RFP-labeled HT1080, PTK7, and shPTK7 metastatic lesions on day 5 post-injection. RFP channel alone is shown for simplicity. Insets show the merged RFP and FITC images, in which FITC labels the vasculature. B, quantification of tumor cell tracks velocity in HT1080, shPTK7, and L622D lesions. C, quantification of cell displacement rate (migration productivity) in HT1080, shPTK7, and L622D lesions. D, representative images of HT1080, PTK7, and shPTK7-induced primary tumors at day 5 post-injection. The dashed line delineates invasive tumor front. Note the polarized, invasive HT1080 cells outside the primary tumor (white arrows). Scale bars, 30 μm.

