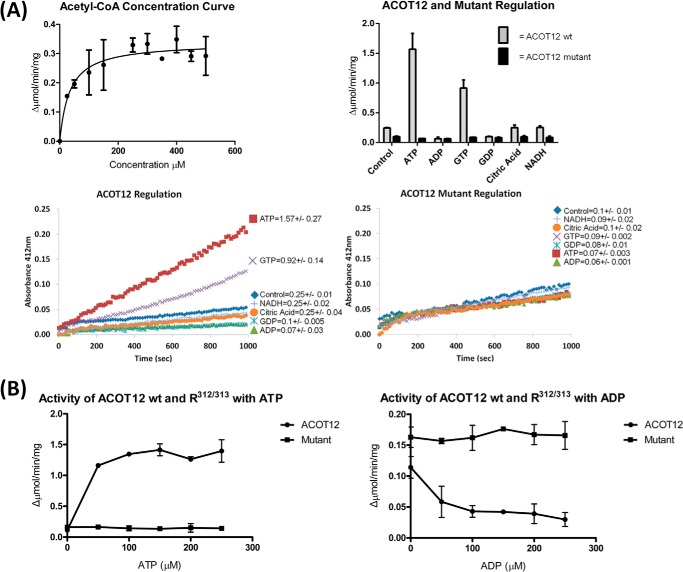
FIGURE 6.
ACOT12 activity and regulation activity. A, the ACOT12 thioesterase activity against acetyl-CoA concentration was plotted in GraphPad Prism using Michaelis-Menten kinetics (left panel). The activity of ACOT12 at 100 μm acetyl-CoA is enhanced by the presence of ATP and decreased by ADP, but this regulatory action is abolished in the Arg312/313 mutant, for which ATP and ADP (or GTP or GDP) show no significant differences (bottom panels, and summarized in right panel). The results shown in the bottom panel are from a single typical experiment repeated two or more times, with pooled data shown in the right panel representing the mean of activity (±) S.D. B, activity curves investigating the activity of ACOT12 and the Arg312/313 mutant over a range of ATP and ADP concentrations. Using the log concentrations of regulator the IC50 = 0.07290 mm for ADP and EC50 = 0.00297 mm for ATP were determined using Graphpad Prism.

