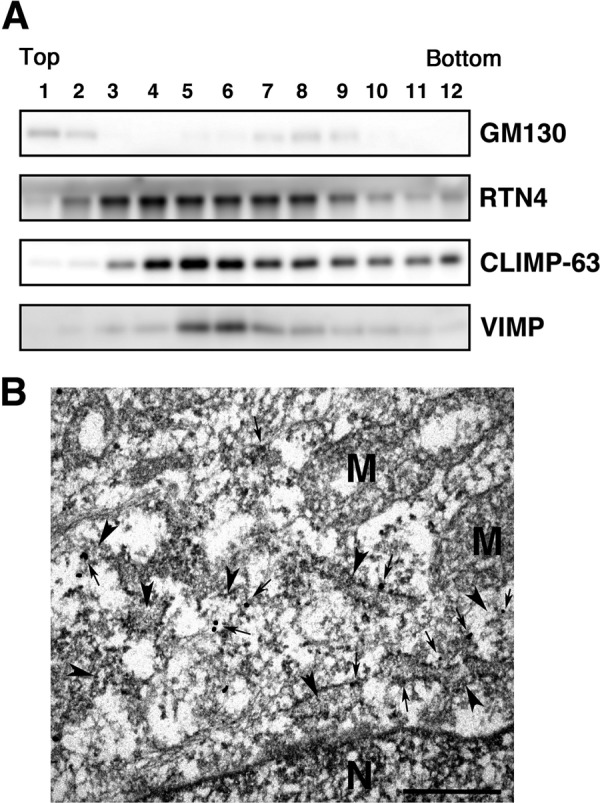
FIGURE 8.

Localization of VIMP. A, lysates of HeLa cells were subjected to fractionation using a 5–25% OptiPrep gradient. Fractions (0.3 ml each) were collected from the top of the gradient. Appropriate portions of each fraction were subjected to SDS-PAGE and analyzed by immunoblotting with antibodies against Golgi marker GM130 (upper panel), RTN4 (second panel), CLIMP-63 (third panel), and VIMP (lower panel). B, immunoelectron micrograph. Arrowheads and arrows indicate ER membranes and immunoreactivity to VIMP, respectively. N and M denote nucleus and mitochondria, respectively. Scale bar = 0.5 μm.
