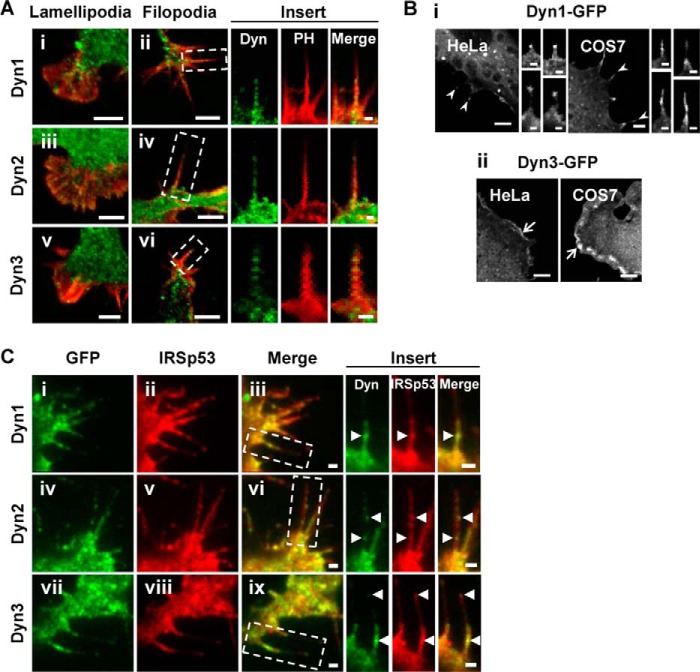
FIGURE 1.
Dyn1–3 localize to lamellipodia and filopodia and colocalize with IRSp53. A, lamellipodia (panels i, iii, and v) and filopodia (panels ii, iv, and vi) were imaged by confocal microscopy. F-actin (red) and endogenous Dyn1 (panels i and ii), Dyn2 (panels iii and iv), and Dyn3 (panels v and vi) (green) were localized as shown. Bar, 5 μm. Filopodia in boxed areas (panels ii, iv, and vi) are shown enlarged as inserts. Bar, 1 μm. The panels show merged and single channel fluorescence images of N1E-115 cells cultured on laminin-coated glass coverslips, immunostained for endogenous Dyn, and counter-stained with A568-phalloidin, as described under “Experimental Procedures.” B, fluorescence images of HeLa and COS-7 cells transfected with Dyn1-GFP (panel i) and Dyn3-GFP (panel ii), respectively, and imaged by confocal microscopy. Bar, 5 μm. Filopodia-like protrusions (arrowheads) induced by ectopic expression of Dyn1-GFP are shown enlarged as inserts. Bar, 1 μm. Membrane ruffles induced by Dyn3-GFP are indicated by arrows. C, representative single channel and merged fluorescence images of cells, transfected to express Dyn1-GFP (panel i), Dyn2-GFP (panel iv), or Dyn3-GFP (panel vii) (green) and mRFP-IRSp53 (panels ii, v, and viii) (red), under ring-TIRF microscopy. Filopodia in boxed areas (panels iii, vi, and ix) are shown enlarged as inserts. Areas of colocalization are indicated by arrowheads. Bar, 1 μm.

