FIGURE 2.
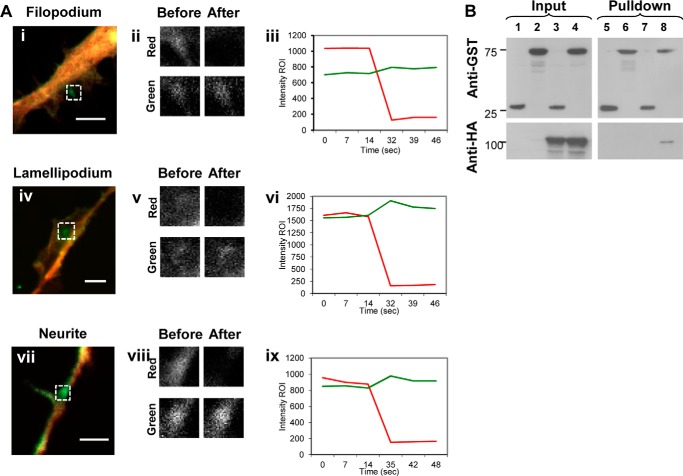
Dyn1 interacts with the SH3 domain of IRSp53. A, N1E-115 cells were fixed 24 h post-transfection. Filopodium (panel i), lamellipodium (panel iv), and neurite (panel vii) containing similar levels of Dyn1-GFP and mRFP-IRSp53 (average intensity of ∼1000 arbitrary units) were selected for AP-FRET experiments. An ROI (indicated by boxed area) was selected, and both GFP and RFP channels were monitored over the time course of the experiment. Once baseline signals for both GFP and mRFP channels were obtained, mRFP signal was bleached using a 561-nm laser, and the intensity levels on green and red channels followed. Fluorescence intensity of the regions of interest before and after photobleaching were shown enlarged (panels ii, v, and viii). Dual channel intensity timelines of AP-FRET experiments of filopodium (panel iii), lamellipodium (panel vi), and neurite (panel ix) are shown with Dyn1-GFP (green line) and mRFP-IRSp53 (red line). Bar, 5 μm. B, GST pulldown of Dyn1. GST pulldown was performed on whole cell lysates of N1E-115 cells and transfected to express HA-Dyn1 and GST-IRSp53 or GST tag alone, using glutathione-Sepharose beads. The pulldown was subjected to SDS-PAGE and WB with antibodies against GST (upper panel) and HA (lower panel). Lanes 1 and 2 are inputs for GST and GST-IRSp53, respectively. Lane 3 is input for GST and HA-Dyn1. Lane 4 is input for GST-IRSp53 and HA-Dyn1. Lanes 5 and 6 are GST pulldowns of GST and GST-IRSp53, respectively. Lane 7 is GST pulldown of HA-Dyn1. Lane 8 is GST-IRSp53 pulldown of HA-Dyn1.

