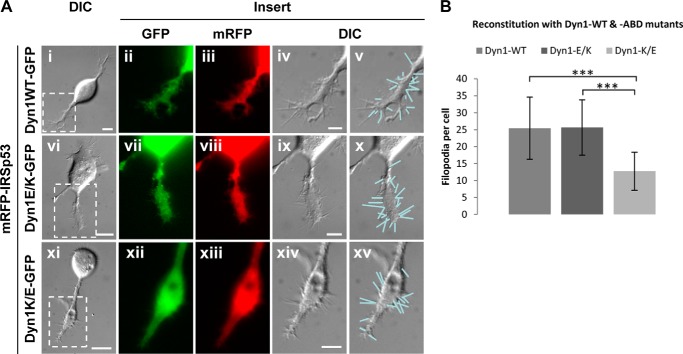
FIGURE 4.
Dyn1 ABD mutants affect filopodial formation. A, differential interference contrast (DIC) and fluorescence images of N1E-115 cells transfected with mRFP-IRSp53 and reconstituted with wild-type Dyn1-GFP (panels i–v), gain-of-function mutant Dyn1E/K-GFP (panels vi–x), and loss-of-function mutant Dyn1K/E-GFP (panels xi–xv) upon Dyn1 knockdown. Bar, 10 μm. Boxed areas are shown enlarged as inserts. Filopodia were indicated by lines on differential interference contrast images. Bar, 5 μm. B, bar chart shows quantitative analysis of filopodia per cell of each group (A). Values were expressed as average ± S.D. (n = 10). Statistical analysis was carried out with Student's t test. Asterisk denotes values with significant difference, i.e. ***, p < 0.001.

