
FIGURE 5.
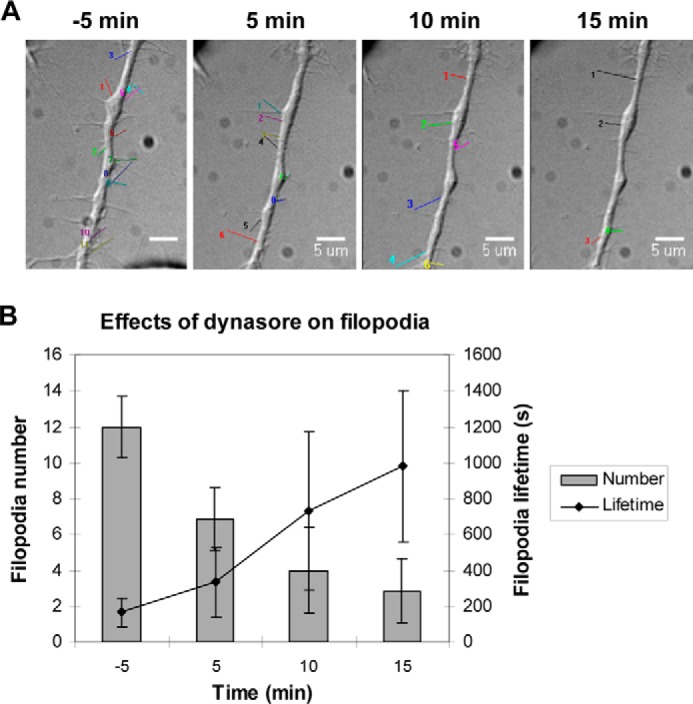
Dynasore affects filopodial number and dynamics. A, representative differential interference contrast images of cells before and after dynasore treatment obtained at 5-min intervals. N1E-115 cells, cultured in 35-mm laminin-coated glass-bottom dishes, were rinsed and incubated with dynasore (80 μm) or vehicle alone (0.2% v/v DMSO) in serum-free DMEM. Wide-field time-lapse imaging was initiated 10 min before the addition of dynasore and terminated up to 30 min after. Dynamic filopodia were highlighted in the time-lapse movies, and their number and lifetime were determined for quantitative analysis. Bar, 5 μm. B, bar chart showing filopodial numbers per cell and lifetime before and after dynasore treatment. Values were expressed as average ± S.D. (n = 7).