FIGURE 7.
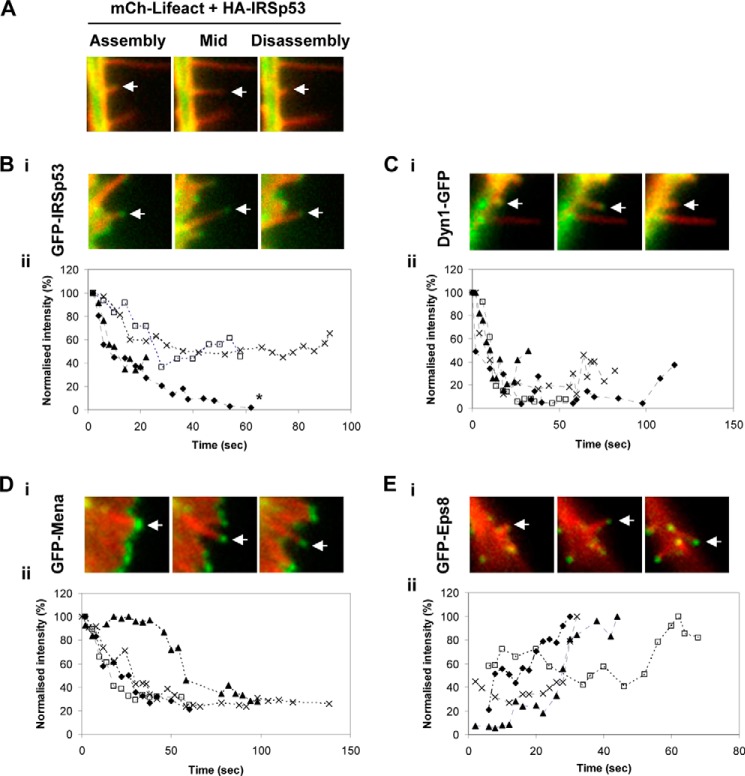
Live cell imaging of IRSp53, Dyn1, Mena, and Eps8, during filopodia assembly and disassembly. N1E-115 cells were transfected with mCherry-lifeact cDNA and cDNA for GFP (A), GFP-IRSp53 (B), Dyn1-GFP (C), GFP-Mena (D) and GFP-Eps8 (E), and filopodia were followed using time-lapse microscopy. Three frames (assembly, mid-assembly, and disassembly) with green (protein) and red (lifeact) channels are shown for each protein. Filopodia dynamics were captured with the ring-TIRF microscope at 2–3-s intervals for 5–10 min, as described under “Experimental Procedures.” Post-acquisition alignment and measurements were performed using ImageJ. The integrated intensity of an ROI between 25 and 30 square pixels at the filopodia tip was determined at each frame. Grayscale intensity value of each frame was normalized to the maximum value (set arbitrarily to 100%) in each data set and plotted over the course of filopodial lifetime. For each protein, normalized intensity plots of four filopodia are shown in B for IRSp53 (panel ii), C for Dyn1 (panel ii), D for Mena (panel ii), and E for Eps8 (panel ii). Asterisk indicates one of the traces showed photobleaching.

