
FIGURE 8.
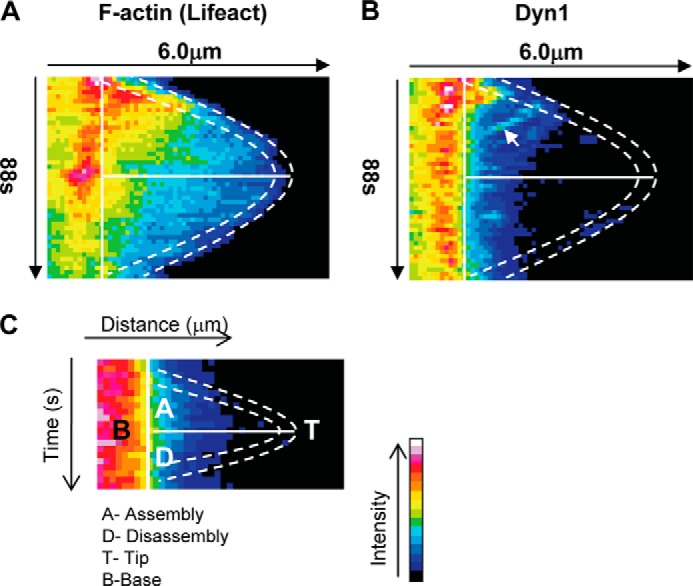
Intra-filopodial movements of Dyn1 during filopodial assembly and disassembly. A, kymographs are dual channel analysis of lifeact marking F-actin (A) and Dyn1(B). Kymographs of filopodial assembly and disassembly were generated by plotting intensity (color-coded) as a function of time (top to bottom) and distance (left to right) using ImageJ, as described under “Experimental Procedures.” The dashed lines trace the filopodial tip, and this position is determined by the end of the lifeact signal. The solid vertical lines demarcate the base of the filopodia. The solid horizontal lines separate the assembly phase from the disassembly phase. C, key to the figure. Rearward movement of Dyn1 is indicated by an arrow.