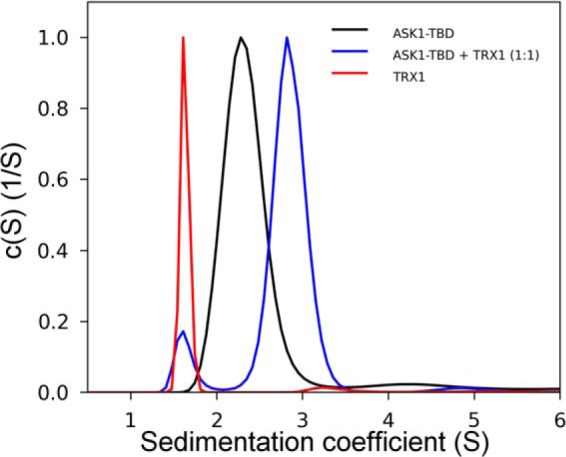
FIGURE 1.

Sedimentation velocity ultracentrifugation. The normalized continuous sedimentation coefficient distributions, c(s), for ASK1-TBD alone (black), TRX1 alone (red), and ASK1-TBD and TRX1 mixed in the molar ratio 1:1 (blue) are shown. All experiments were performed under reducing conditions.
