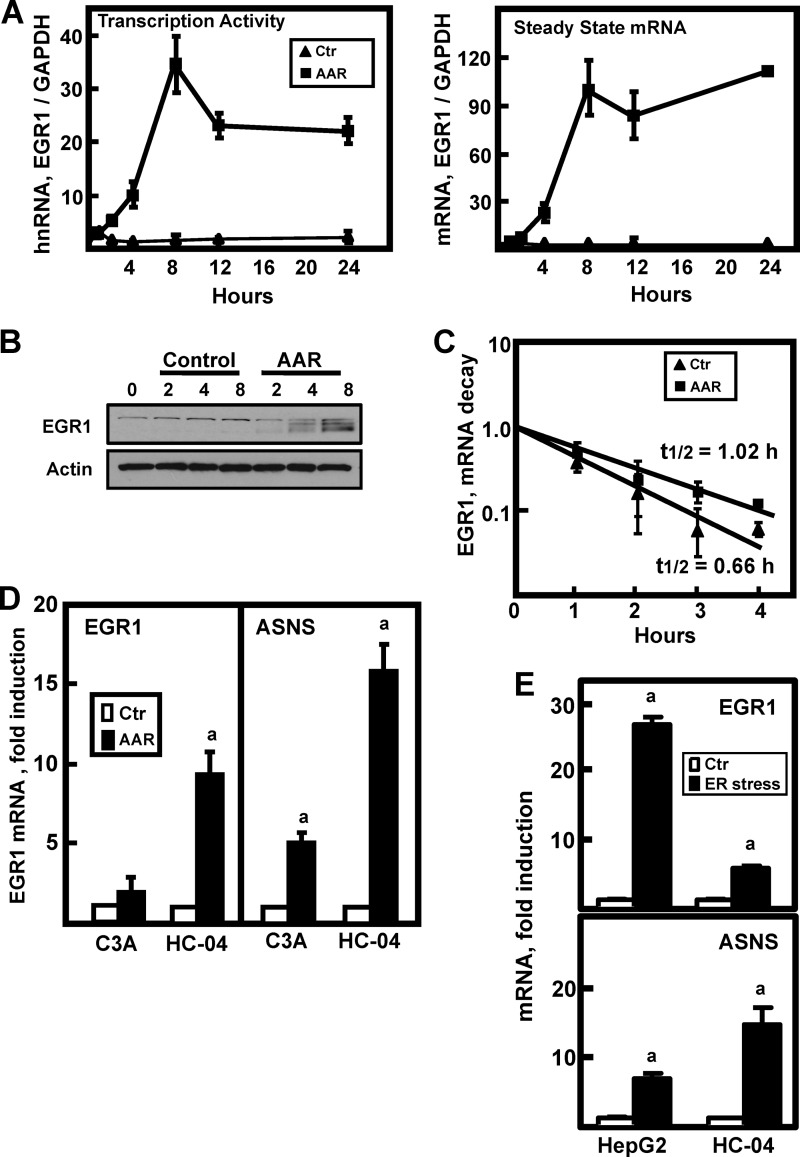
FIGURE 1.
Activation of the EGR1 gene by the AAR. A, HepG2 cells were incubated in DMEM (Ctr) or DMEM lacking histidine (AAR) to activate the AAR. RNA was isolated at the times indicated, and EGR1 transcription activity (by assaying hnRNA) or steady state mRNA levels were measured using qPCR as described under “Experimental Procedures.” The data were plotted as the ratio of the respective EGR1 RNA to the GAPDH control, and normalized relative to the DMEM t = 0 value. The results are presented as the averages ± standard deviations of three or more samples and are representative of multiple independent experiments. B, after incubating HepG2 cells in DMEM (Control) or DMEM lacking histidine (AAR) for the times indicated, whole cell extracts were subjected to immunoblot analysis for EGR1 or actin. A representative blot of multiple experiments is shown. C, to test for a possible effect of the AAR on EGR1 mRNA stabilization, HepG2 cells were incubated in DMEM + 2 mm HisOH (AAR) for 4 h to activate the AAR, and then the cells were transferred to fresh DMEM (Ctr) or DMEM + 2 mm HisOH (AAR) with both media containing 5 μm actinomycin D. After the transfer, RNA was isolated at the times indicated, and then EGR1 and GAPDH mRNA were measured by qPCR. The data are presented as a semi-log plot and the half-life calculated using the equation t½ = −0.693/k. D, a subclone of HepG2 cells, C3A cells, and nontransformed, immortalized HC-04 human hepatocytes were incubated for 6 h in DMEM (Ctr) or DMEM + 2 mm HisOH (AAR) to activate the AAR. RNA was isolated, and the steady state ASNS and EGR1 mRNA levels were analyzed. The data are normalized relative to the DMEM values to illustrate the relative fold induction. E, HepG2 hepatoma cells or HC-04 hepatocytes were incubated in DMEM (Ctr) or DMEM containing 100 nm thapsigargin (ER stress) for 6 h to trigger ER stress and activate the unfolded protein response pathways. RNA was isolated, and EGR1, ASNS, and GAPDH mRNA levels were measured. The data were plotted as the ratio of EGR1 or ASNS mRNA to the GAPDH control and normalized relative to the DMEM value. For all of the RNA data, the results are shown as the averages ± standard deviations of three or four assays per experiment and are representative of multiple independent experiments. An a indicates that the AAR value is different from the DMEM control at p ≤ 0.05.

