
Fig. 1.
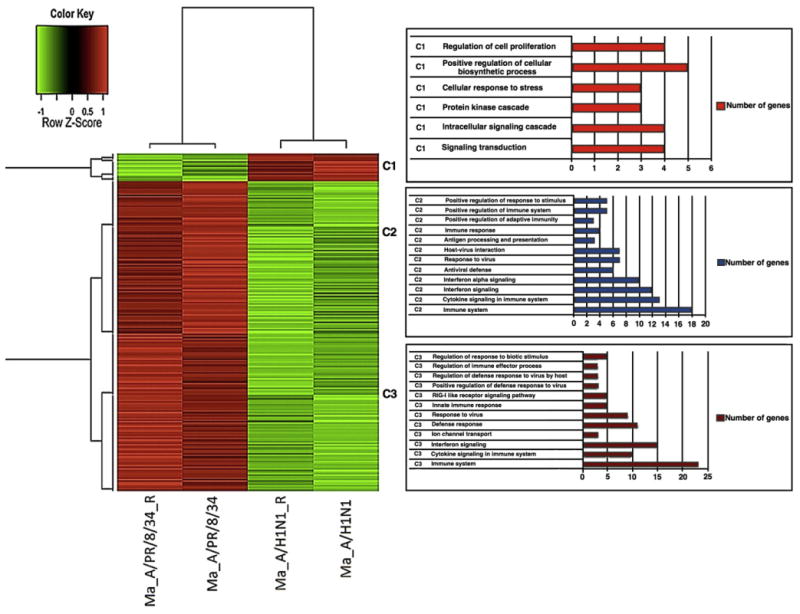
Heatmap showing differences in gene expression by macrophages infected with pdm A/H1N1 compared to seasonal A/PR/8/34 influenza viruses. Samples and replicates are listed in columns; red highlighting indicates high expression and green highlighting indicates low expression. Dendograms indicating the similarity of gene expression between the macrophages infected with different viral strains are shown (left). The numbers of genes in each cluster involved with specific pathways are shown in the right panel.