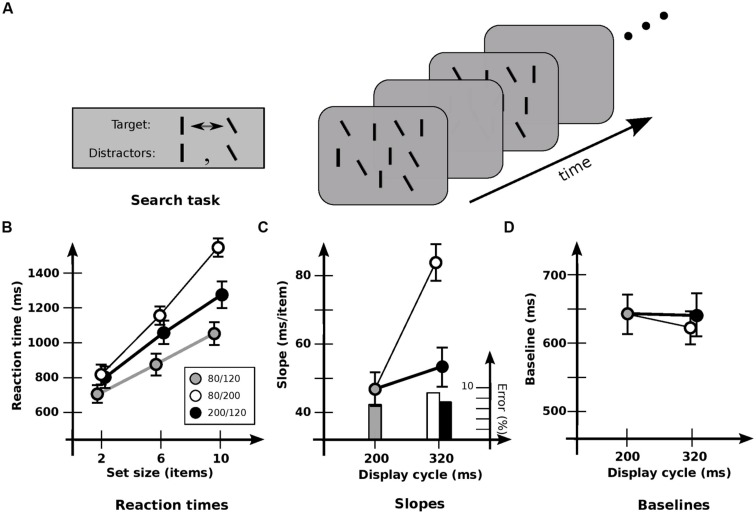
FIGURE 2.
Experiment 2: detection of orientation change. (A) Stimuli used. ~50% of lines in each display are vertical, and 50% are tilted by 30° counterclockwise. Target is the item that changes between vertical and tilted; distractors are those items that maintain a constant orientation. (B) Response times and error rates as a function of set size for the three cadences. (C) Data recast as slopes. Slope for base cadence (47.3 ms/item) is strongly affected by an increase in off-time (83.0 ms/item) but not by an increase in on-time (53.7 ms/item). (D) Data recast as baselines. Values for the 80/240 and 200/120 cadences have been subtracted by 120 ms to equate the time of first appearance of the changed item. Baseline for base cadence (645 ms) is not significantly affected by an increase in off-time (615 ms) or on-time (641 ms). Error bars indicate standard error of the mean.

