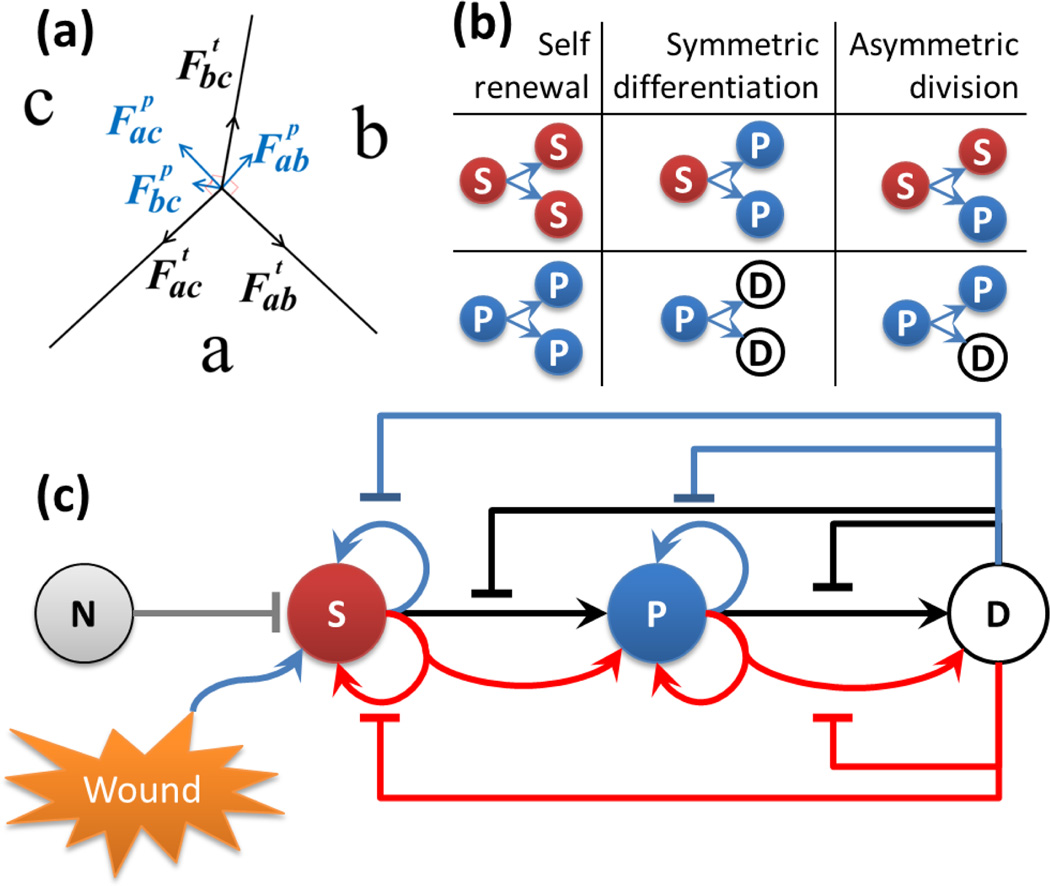
Fig.1.
Our model. (a) The forces at the junction vertex of three cells a, b and c in our cell growth model. Tension is tangential to the edge (black). Pressure is normal to the edge (blue). The net force on the junction vertex is obtained by summing tension and pressure acting on the vertex. (b) Division types of stem cells and progenitor cells. Red sphere labeled with (S) indicates stem cells, blue sphere (P) indicates progenitor cells, and white sphere (D) indicates differentiated cell. The same color code is used for illustration of resulting tissues. (c) Feedback controls of stem cell lineage. The gray (N) sphere indicates niche cells. Blue arrows indicate self-renewal or proliferation divisions. Black arrows indicate symmetric divisions. Red arrows indicate asymmetric divisions. Flat-head arrows extending from differentiated cell with corresponding colors indicate inhibitions to respective type of divisions.

