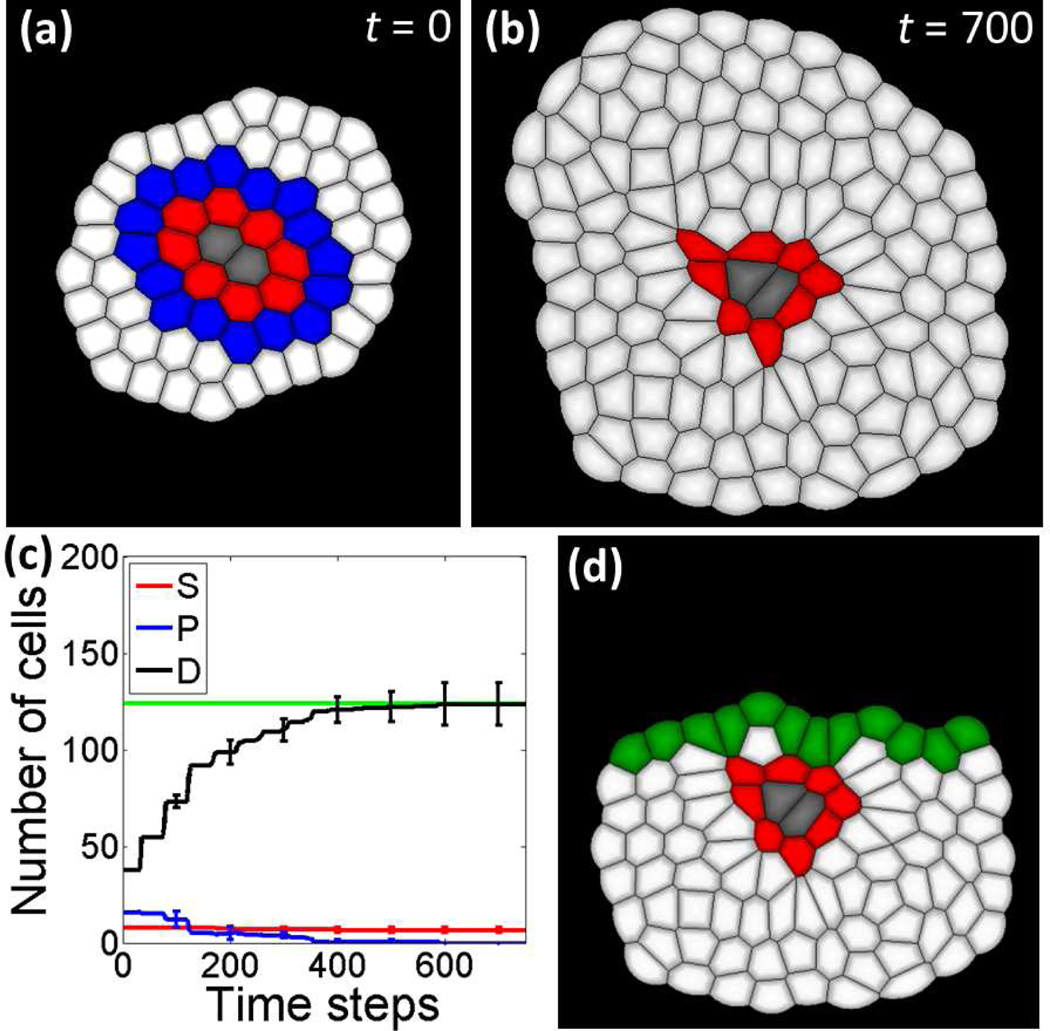
Fig.2.
Normal tissue and wound infliction. (a) Small starting cell group for simulations of the temporal-spatial dynamics model contains 64 cells. Niche cells are labeled in gray, stem cells are in red, progenitor cells are in blue, and differentiated cells are in white. (b) One example normal tissue achieved homeostatic size control. This steady state tissue contains 8 stem cells, 2 niche cells and 120 differentiated cells. (C) Dynamics of cell numbers during tissue development. The red curve shows the dynamics of stem cell numbers, the blue line is progenitor cells, and the black line is differentiated cells. Error bars show the standard deviations at 100, 200, 300, 400, 500, 600 and 700 time steps are calculated from four independent simulations, respectively. The average number of differentiated cells in the steady state is shown in the green straight line. (d) Wound infliction is created by cut the top part of the normal tissue in (b). Cells at the wound edge are shown in green.

