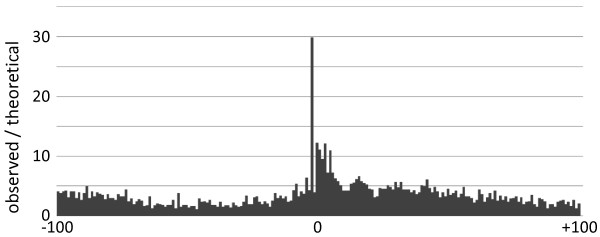
Figure 2.

Distribution of the TYAYWWW motif around TSSs. The horizontal axis represents sequence areas from -100 to +100 around TSSs with 1-nt resolution. Position 0 represents TSS. A peak was observed at the -2 position. The vertical axis represents the ratio of the motif frequency and the theoretical frequency (see Methods).
