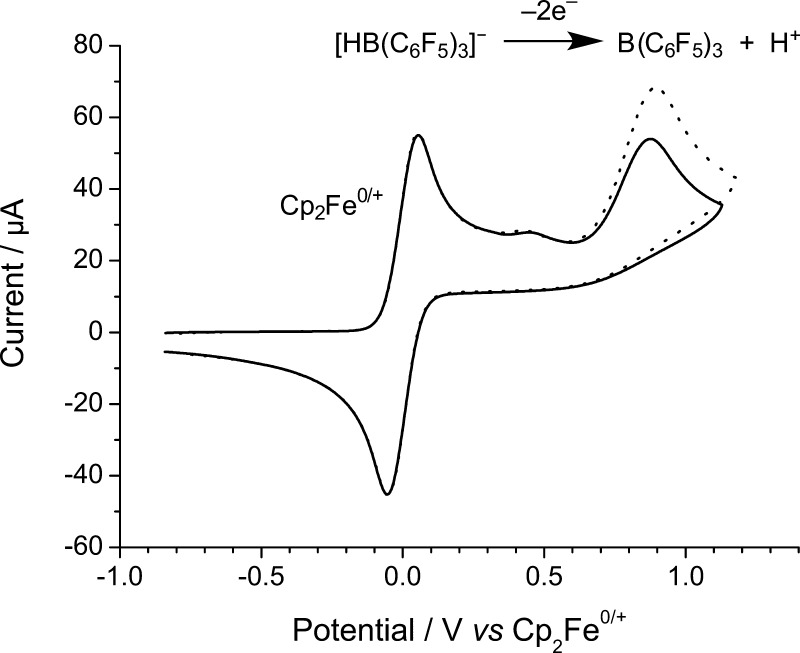
Figure 5.
Cyclic voltammogram of a 5 mM solution of tBu3P and B(C6F5)3 in CH2Cl2 solution, at a GCE, after being exposed to a 1 h sparge with H2 (black line). Addition of authentic [nBu4N]1 (dotted line) to the sample confirms that the observed oxidation wave corresponds to the H2-activated product. The cyclic voltammograms were taken in the presence of a Cp2Fe internal reference at a voltage scan rate of 100 mV s–1.

