
Figure 5.
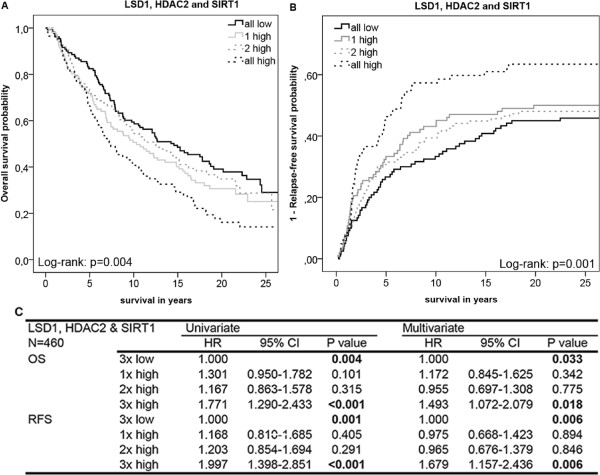
Survival analyses of the combined expression levels of LSD1, HDAC2 and SIRT1. Univariate Kaplan-Meier (KM) plot showing overall survival (OS) (A) and a cumulative incidence curve showing relapse-free survival (RFS) (B) of breast cancer patients for the combined expression levels of LSD1, HDAC2 and SIRT1. The patients were categorized in four subgroups depending on the expression levels of the histon-modifying enzymes. Subgroups: ‘All low’: expression of all three enzymes below median, ‘1 high’: one of the enzymes expressed above median, ‘2 high’: two enzymes expressed above median, ‘all high’: all three enzymes expressed above median. (C) The Cox proportional hazard model was used for evaluation of the HRs and the 95% confidence intervals (95% CI) of the combined expression levels of LSD1, HDAC2 and SIRT1 for OS and RFS in the four subgroups. Significant p-values (≤0.05) are indicated in bold.