
Figure 6.
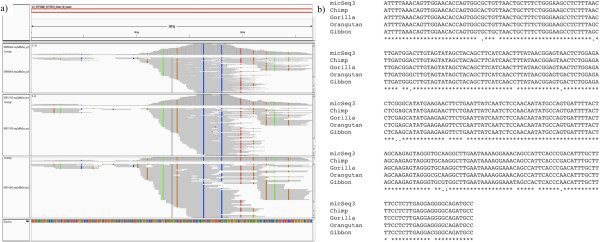
Example of expressed micSeqs detected from RNA-seq data. a) Reads aligned to micSeq3. Note that the reads depth can be up to more than 100, indicting it is moderately expressed. The color columns indicate that the reads have different nucleotides with micSeq3 probably because of SNPs or RNA editing. b) Homologs of micSeqs with high sequence similarity can be identified in other primates.