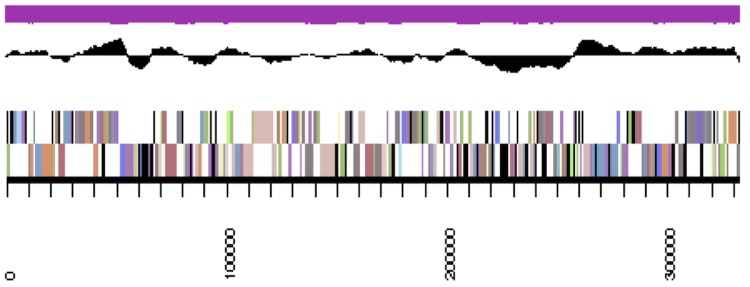
Figure 3c.

Graphical map of LMG 23256_A19UDRAFT_scaffold_2.3 of the B. mimosarum strain LMG 23256T genome. From bottom to the top of each scaffold: Genes on forward strand (color by COG categories as denoted by the IMG platform), Genes on reverse strand (color by COG categories), RNA genes (tRNAs green, sRNAs red, other RNAs black), GC content, GC skew.
